Trinidadian and Tobagonian vs Cajun In Labor Force | Age 20-64
COMPARE
Trinidadian and Tobagonian
Cajun
In Labor Force | Age 20-64
In Labor Force | Age 20-64 Comparison
Trinidadians and Tobagonians
Cajuns
79.0%
IN LABOR FORCE | AGE 20-64
2.3/ 100
METRIC RATING
240th/ 347
METRIC RANK
75.5%
IN LABOR FORCE | AGE 20-64
0.0/ 100
METRIC RATING
323rd/ 347
METRIC RANK
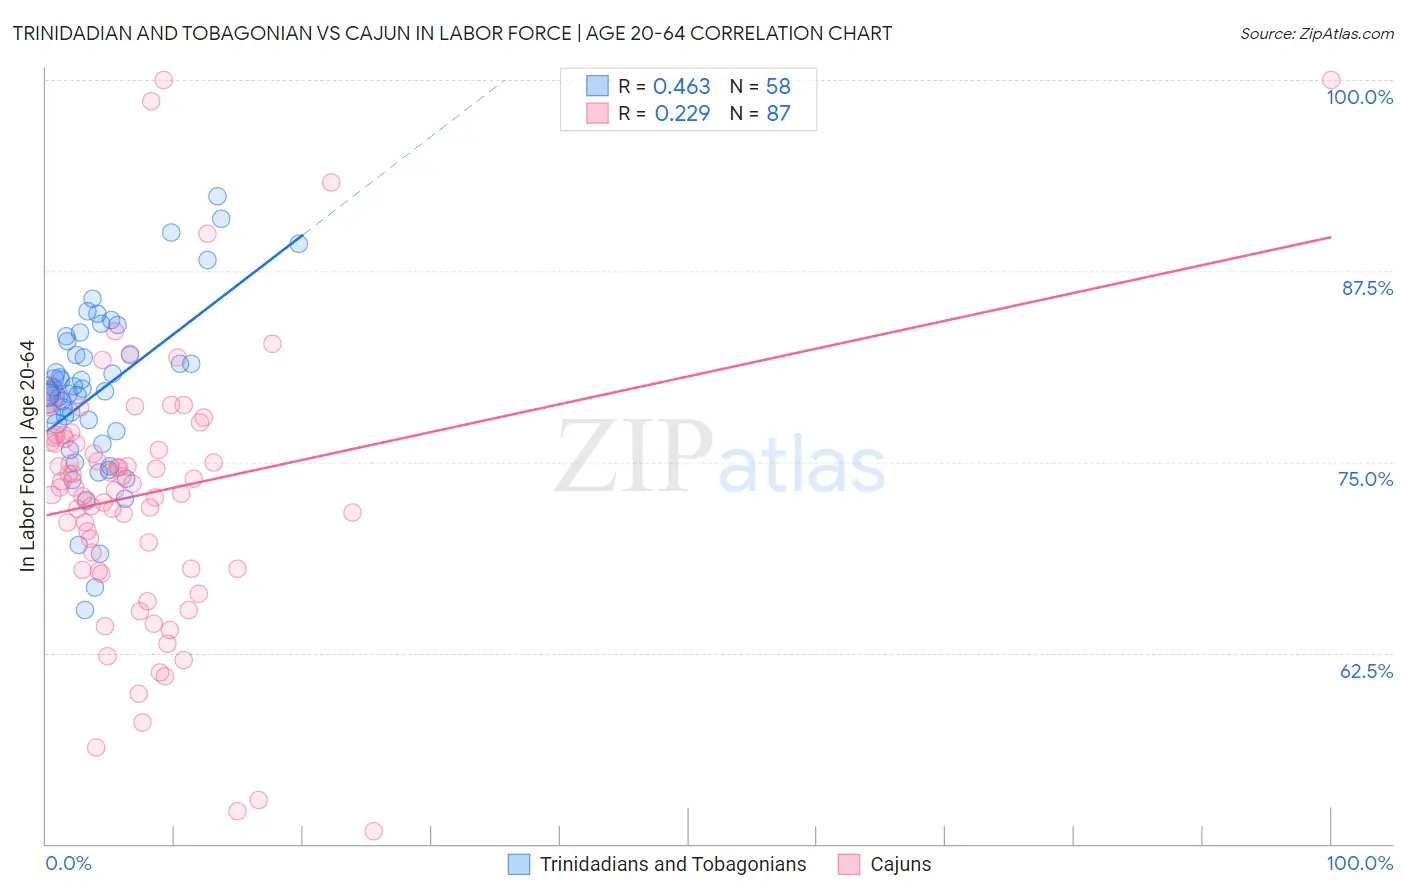
Trinidadian and Tobagonian vs Cajun In Labor Force | Age 20-64 Correlation Chart
The statistical analysis conducted on geographies consisting of 219,883,468 people shows a moderate positive correlation between the proportion of Trinidadians and Tobagonians and labor force participation rate among population between the ages 20 and 64 in the United States with a correlation coefficient (R) of 0.463 and weighted average of 79.0%. Similarly, the statistical analysis conducted on geographies consisting of 149,713,173 people shows a weak positive correlation between the proportion of Cajuns and labor force participation rate among population between the ages 20 and 64 in the United States with a correlation coefficient (R) of 0.229 and weighted average of 75.5%, a difference of 4.6%.
In Labor Force | Age 20-64 Correlation Summary
| Measurement | Trinidadian and Tobagonian | Cajun |
| Minimum | 65.3% | 50.8% |
| Maximum | 92.4% | 100.0% |
| Range | 27.1% | 49.2% |
| Mean | 79.5% | 72.9% |
| Median | 79.6% | 73.4% |
| Interquartile 25% (IQ1) | 77.0% | 68.0% |
| Interquartile 75% (IQ3) | 82.0% | 76.6% |
| Interquartile Range (IQR) | 5.0% | 8.6% |
| Standard Deviation (Sample) | 5.4% | 9.0% |
| Standard Deviation (Population) | 5.4% | 8.9% |
Similar Demographics by In Labor Force | Age 20-64
Demographics Similar to Trinidadians and Tobagonians by In Labor Force | Age 20-64
In terms of in labor force | age 20-64, the demographic groups most similar to Trinidadians and Tobagonians are Welsh (79.0%, a difference of 0.010%), Immigrants from Jamaica (79.0%, a difference of 0.020%), Jamaican (78.9%, a difference of 0.030%), Immigrants from North America (79.0%, a difference of 0.040%), and Immigrants from Micronesia (78.9%, a difference of 0.040%).
| Demographics | Rating | Rank | In Labor Force | Age 20-64 |
| Japanese | 4.0 /100 | #233 | Tragic 79.1% |
| Immigrants | Canada | 3.2 /100 | #234 | Tragic 79.0% |
| Tlingit-Haida | 3.2 /100 | #235 | Tragic 79.0% |
| Samoans | 2.9 /100 | #236 | Tragic 79.0% |
| Immigrants | North America | 2.9 /100 | #237 | Tragic 79.0% |
| Immigrants | Jamaica | 2.6 /100 | #238 | Tragic 79.0% |
| Welsh | 2.4 /100 | #239 | Tragic 79.0% |
| Trinidadians and Tobagonians | 2.3 /100 | #240 | Tragic 79.0% |
| Jamaicans | 2.0 /100 | #241 | Tragic 78.9% |
| Immigrants | Micronesia | 1.9 /100 | #242 | Tragic 78.9% |
| Immigrants | West Indies | 1.7 /100 | #243 | Tragic 78.9% |
| French | 1.5 /100 | #244 | Tragic 78.9% |
| Scottish | 1.3 /100 | #245 | Tragic 78.9% |
| Immigrants | Trinidad and Tobago | 1.1 /100 | #246 | Tragic 78.8% |
| Immigrants | Germany | 1.0 /100 | #247 | Tragic 78.8% |
Demographics Similar to Cajuns by In Labor Force | Age 20-64
In terms of in labor force | age 20-64, the demographic groups most similar to Cajuns are Dutch West Indian (75.5%, a difference of 0.040%), Choctaw (75.4%, a difference of 0.060%), Seminole (75.5%, a difference of 0.090%), Menominee (75.3%, a difference of 0.19%), and Creek (75.1%, a difference of 0.42%).
| Demographics | Rating | Rank | In Labor Force | Age 20-64 |
| Yaqui | 0.0 /100 | #316 | Tragic 76.5% |
| Cherokee | 0.0 /100 | #317 | Tragic 76.2% |
| Chickasaw | 0.0 /100 | #318 | Tragic 76.2% |
| Inupiat | 0.0 /100 | #319 | Tragic 76.1% |
| Yakama | 0.0 /100 | #320 | Tragic 75.8% |
| Seminole | 0.0 /100 | #321 | Tragic 75.5% |
| Dutch West Indians | 0.0 /100 | #322 | Tragic 75.5% |
| Cajuns | 0.0 /100 | #323 | Tragic 75.5% |
| Choctaw | 0.0 /100 | #324 | Tragic 75.4% |
| Menominee | 0.0 /100 | #325 | Tragic 75.3% |
| Creek | 0.0 /100 | #326 | Tragic 75.1% |
| Sioux | 0.0 /100 | #327 | Tragic 75.0% |
| Kiowa | 0.0 /100 | #328 | Tragic 75.0% |
| Cheyenne | 0.0 /100 | #329 | Tragic 74.8% |
| Colville | 0.0 /100 | #330 | Tragic 74.8% |