Armenian vs Arab 3rd Grade
COMPARE
Armenian
Arab
3rd Grade
3rd Grade Comparison
Armenians
Arabs
97.3%
3RD GRADE
0.4/ 100
METRIC RATING
259th/ 347
METRIC RANK
97.7%
3RD GRADE
40.0/ 100
METRIC RATING
183rd/ 347
METRIC RANK
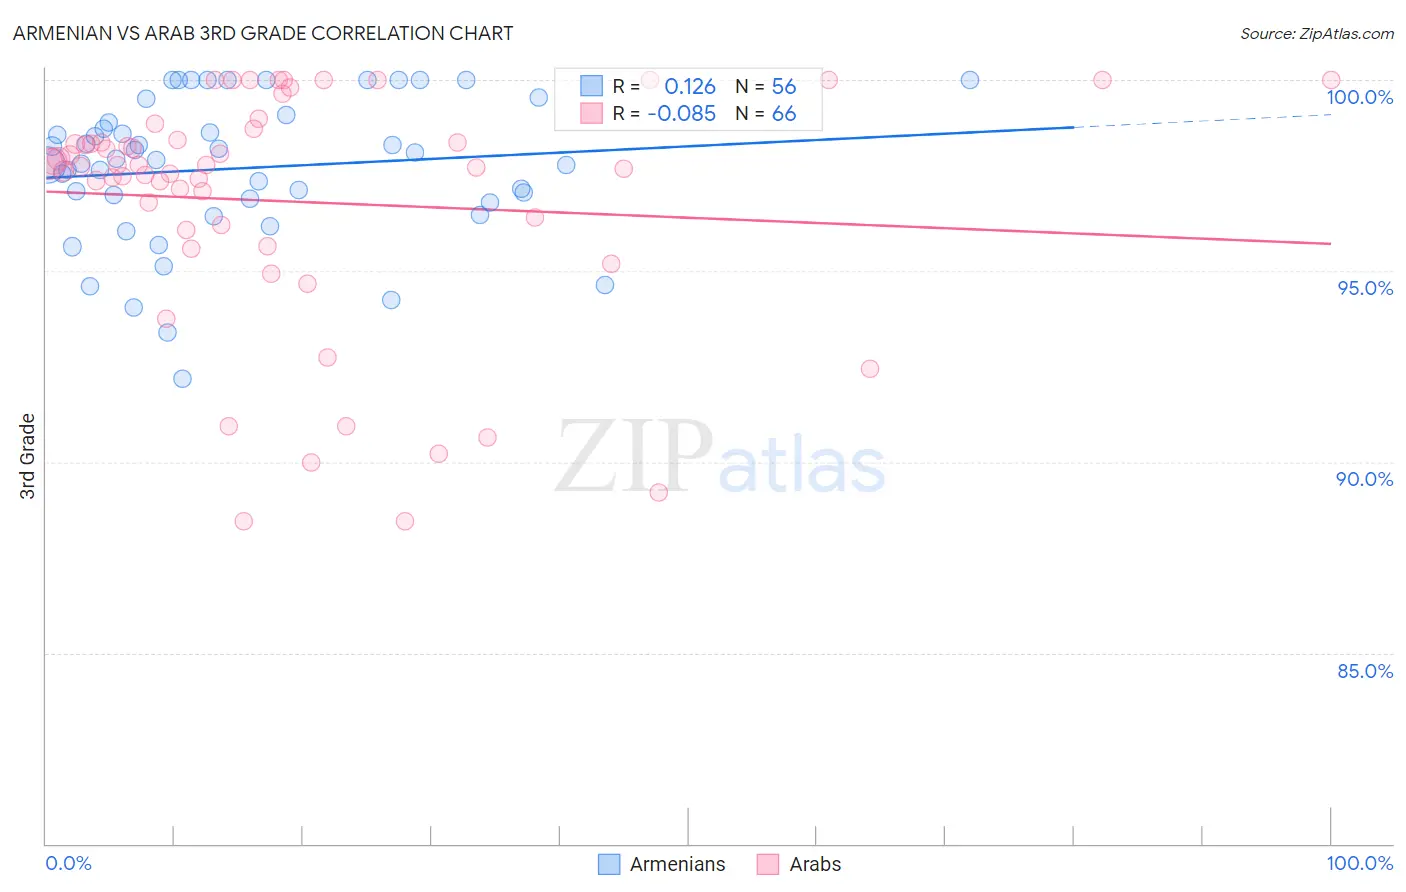
Armenian vs Arab 3rd Grade Correlation Chart
The statistical analysis conducted on geographies consisting of 310,954,660 people shows a poor positive correlation between the proportion of Armenians and percentage of population with at least 3rd grade education in the United States with a correlation coefficient (R) of 0.126 and weighted average of 97.3%. Similarly, the statistical analysis conducted on geographies consisting of 486,872,222 people shows a slight negative correlation between the proportion of Arabs and percentage of population with at least 3rd grade education in the United States with a correlation coefficient (R) of -0.085 and weighted average of 97.7%, a difference of 0.43%.
3rd Grade Correlation Summary
| Measurement | Armenian | Arab |
| Minimum | 92.2% | 88.4% |
| Maximum | 100.0% | 100.0% |
| Range | 7.8% | 11.6% |
| Mean | 97.7% | 96.8% |
| Median | 97.9% | 97.8% |
| Interquartile 25% (IQ1) | 96.8% | 96.1% |
| Interquartile 75% (IQ3) | 99.0% | 98.4% |
| Interquartile Range (IQR) | 2.1% | 2.4% |
| Standard Deviation (Sample) | 1.9% | 3.1% |
| Standard Deviation (Population) | 1.9% | 3.1% |
Similar Demographics by 3rd Grade
Demographics Similar to Armenians by 3rd Grade
In terms of 3rd grade, the demographic groups most similar to Armenians are Immigrants from Liberia (97.3%, a difference of 0.010%), Immigrants from Ethiopia (97.3%, a difference of 0.010%), Immigrants from South America (97.3%, a difference of 0.010%), Immigrants from Congo (97.3%, a difference of 0.020%), and Immigrants from Colombia (97.3%, a difference of 0.020%).
| Demographics | Rating | Rank | 3rd Grade |
| Peruvians | 0.8 /100 | #252 | Tragic 97.4% |
| Immigrants | Africa | 0.8 /100 | #253 | Tragic 97.4% |
| Jamaicans | 0.7 /100 | #254 | Tragic 97.4% |
| Bolivians | 0.6 /100 | #255 | Tragic 97.3% |
| Immigrants | Congo | 0.6 /100 | #256 | Tragic 97.3% |
| Immigrants | Colombia | 0.5 /100 | #257 | Tragic 97.3% |
| Immigrants | Liberia | 0.5 /100 | #258 | Tragic 97.3% |
| Armenians | 0.4 /100 | #259 | Tragic 97.3% |
| Immigrants | Ethiopia | 0.4 /100 | #260 | Tragic 97.3% |
| Immigrants | South America | 0.4 /100 | #261 | Tragic 97.3% |
| Immigrants | Sierra Leone | 0.4 /100 | #262 | Tragic 97.3% |
| Taiwanese | 0.3 /100 | #263 | Tragic 97.3% |
| West Indians | 0.3 /100 | #264 | Tragic 97.3% |
| Immigrants | Jamaica | 0.3 /100 | #265 | Tragic 97.3% |
| Yaqui | 0.3 /100 | #266 | Tragic 97.3% |
Demographics Similar to Arabs by 3rd Grade
In terms of 3rd grade, the demographic groups most similar to Arabs are Argentinean (97.7%, a difference of 0.010%), Immigrants from Kazakhstan (97.7%, a difference of 0.010%), Immigrants from Argentina (97.7%, a difference of 0.010%), Portuguese (97.7%, a difference of 0.010%), and Immigrants from Poland (97.8%, a difference of 0.020%).
| Demographics | Rating | Rank | 3rd Grade |
| Immigrants | Poland | 47.1 /100 | #176 | Average 97.8% |
| Egyptians | 46.6 /100 | #177 | Average 97.7% |
| Immigrants | Brazil | 46.4 /100 | #178 | Average 97.7% |
| Immigrants | Belarus | 45.9 /100 | #179 | Average 97.7% |
| Immigrants | Sri Lanka | 45.1 /100 | #180 | Average 97.7% |
| Immigrants | Venezuela | 44.4 /100 | #181 | Average 97.7% |
| Argentineans | 42.9 /100 | #182 | Average 97.7% |
| Arabs | 40.0 /100 | #183 | Fair 97.7% |
| Immigrants | Kazakhstan | 37.4 /100 | #184 | Fair 97.7% |
| Immigrants | Argentina | 37.0 /100 | #185 | Fair 97.7% |
| Portuguese | 36.2 /100 | #186 | Fair 97.7% |
| Natives/Alaskans | 35.2 /100 | #187 | Fair 97.7% |
| Immigrants | Taiwan | 34.2 /100 | #188 | Fair 97.7% |
| Pakistanis | 34.2 /100 | #189 | Fair 97.7% |
| Panamanians | 31.5 /100 | #190 | Fair 97.7% |