Arapaho vs Senegalese In Labor Force | Age 20-64
COMPARE
Arapaho
Senegalese
In Labor Force | Age 20-64
In Labor Force | Age 20-64 Comparison
Arapaho
Senegalese
74.4%
IN LABOR FORCE | AGE 20-64
0.0/ 100
METRIC RATING
332nd/ 347
METRIC RANK
79.7%
IN LABOR FORCE | AGE 20-64
69.1/ 100
METRIC RATING
156th/ 347
METRIC RANK
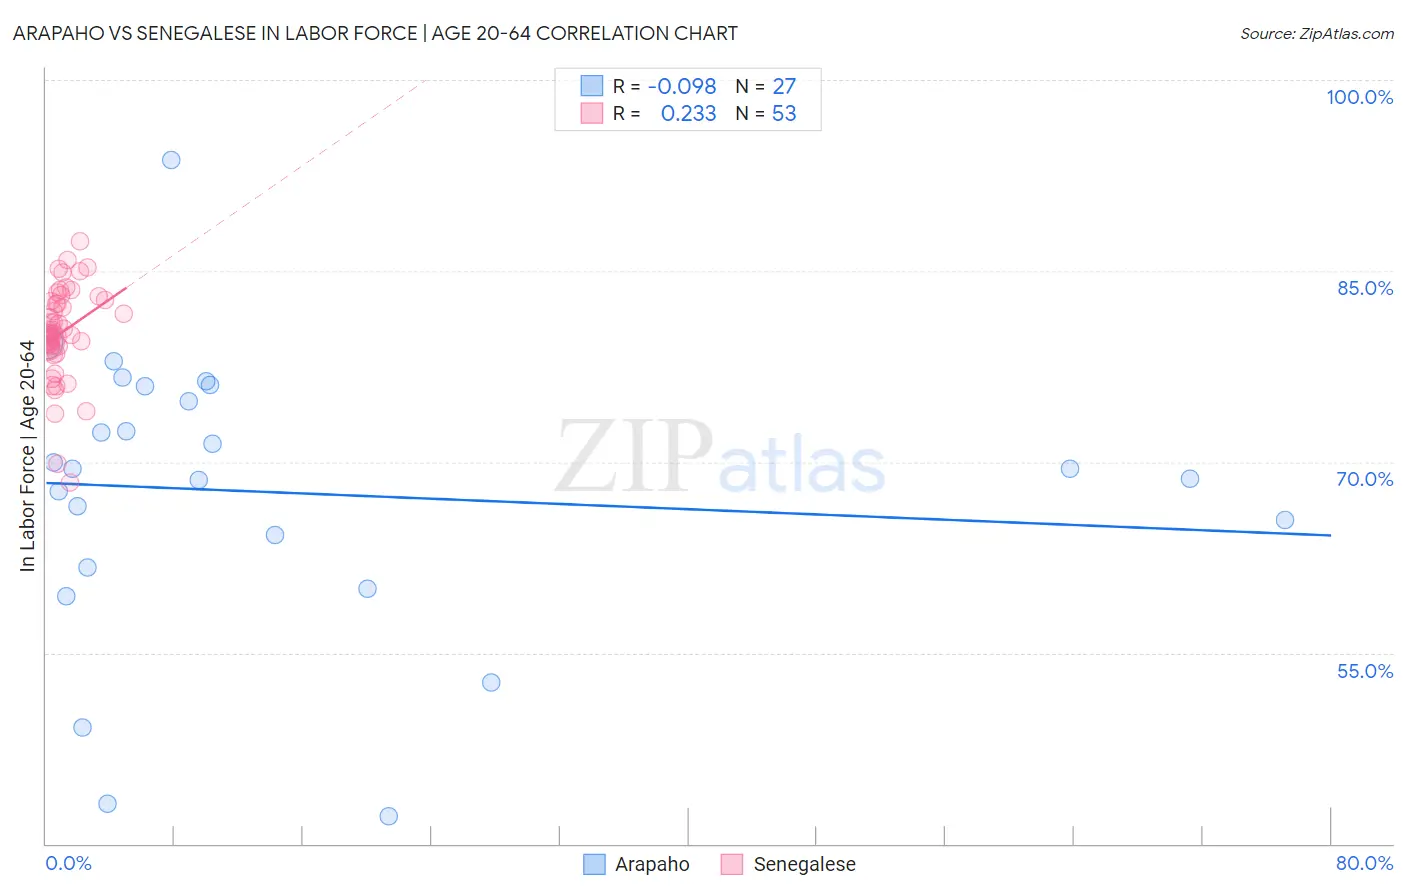
Arapaho vs Senegalese In Labor Force | Age 20-64 Correlation Chart
The statistical analysis conducted on geographies consisting of 29,780,325 people shows a slight negative correlation between the proportion of Arapaho and labor force participation rate among population between the ages 20 and 64 in the United States with a correlation coefficient (R) of -0.098 and weighted average of 74.4%. Similarly, the statistical analysis conducted on geographies consisting of 78,141,567 people shows a weak positive correlation between the proportion of Senegalese and labor force participation rate among population between the ages 20 and 64 in the United States with a correlation coefficient (R) of 0.233 and weighted average of 79.7%, a difference of 7.1%.
In Labor Force | Age 20-64 Correlation Summary
| Measurement | Arapaho | Senegalese |
| Minimum | 42.2% | 68.4% |
| Maximum | 93.7% | 87.3% |
| Range | 51.5% | 18.9% |
| Mean | 67.6% | 80.2% |
| Median | 69.5% | 80.1% |
| Interquartile 25% (IQ1) | 61.7% | 79.0% |
| Interquartile 75% (IQ3) | 75.9% | 82.7% |
| Interquartile Range (IQR) | 14.2% | 3.6% |
| Standard Deviation (Sample) | 11.3% | 3.7% |
| Standard Deviation (Population) | 11.1% | 3.7% |
Similar Demographics by In Labor Force | Age 20-64
Demographics Similar to Arapaho by In Labor Force | Age 20-64
In terms of in labor force | age 20-64, the demographic groups most similar to Arapaho are Paiute (74.7%, a difference of 0.40%), Colville (74.8%, a difference of 0.54%), Cheyenne (74.8%, a difference of 0.60%), Native/Alaskan (73.9%, a difference of 0.66%), and Kiowa (75.0%, a difference of 0.80%).
| Demographics | Rating | Rank | In Labor Force | Age 20-64 |
| Menominee | 0.0 /100 | #325 | Tragic 75.3% |
| Creek | 0.0 /100 | #326 | Tragic 75.1% |
| Sioux | 0.0 /100 | #327 | Tragic 75.0% |
| Kiowa | 0.0 /100 | #328 | Tragic 75.0% |
| Cheyenne | 0.0 /100 | #329 | Tragic 74.8% |
| Colville | 0.0 /100 | #330 | Tragic 74.8% |
| Paiute | 0.0 /100 | #331 | Tragic 74.7% |
| Arapaho | 0.0 /100 | #332 | Tragic 74.4% |
| Natives/Alaskans | 0.0 /100 | #333 | Tragic 73.9% |
| Apache | 0.0 /100 | #334 | Tragic 73.7% |
| Ute | 0.0 /100 | #335 | Tragic 73.7% |
| Crow | 0.0 /100 | #336 | Tragic 73.3% |
| Yup'ik | 0.0 /100 | #337 | Tragic 73.2% |
| Puerto Ricans | 0.0 /100 | #338 | Tragic 73.1% |
| Houma | 0.0 /100 | #339 | Tragic 72.7% |
Demographics Similar to Senegalese by In Labor Force | Age 20-64
In terms of in labor force | age 20-64, the demographic groups most similar to Senegalese are Immigrants from Kazakhstan (79.7%, a difference of 0.0%), New Zealander (79.7%, a difference of 0.0%), Immigrants from South Africa (79.7%, a difference of 0.0%), Immigrants from China (79.7%, a difference of 0.0%), and Austrian (79.7%, a difference of 0.010%).
| Demographics | Rating | Rank | In Labor Force | Age 20-64 |
| Icelanders | 75.1 /100 | #149 | Good 79.7% |
| Costa Ricans | 72.4 /100 | #150 | Good 79.7% |
| Scandinavians | 72.0 /100 | #151 | Good 79.7% |
| Immigrants | Northern Europe | 72.0 /100 | #152 | Good 79.7% |
| Immigrants | Kazakhstan | 69.5 /100 | #153 | Good 79.7% |
| New Zealanders | 69.4 /100 | #154 | Good 79.7% |
| Immigrants | South Africa | 69.2 /100 | #155 | Good 79.7% |
| Senegalese | 69.1 /100 | #156 | Good 79.7% |
| Immigrants | China | 69.1 /100 | #157 | Good 79.7% |
| Austrians | 67.6 /100 | #158 | Good 79.7% |
| Immigrants | Cuba | 66.7 /100 | #159 | Good 79.7% |
| Moroccans | 66.7 /100 | #160 | Good 79.7% |
| South Africans | 66.2 /100 | #161 | Good 79.7% |
| Germans | 65.2 /100 | #162 | Good 79.7% |
| Immigrants | Costa Rica | 64.6 /100 | #163 | Good 79.7% |