Arapaho vs Senegalese Householder Income Under 25 years
COMPARE
Arapaho
Senegalese
Householder Income Under 25 years
Householder Income Under 25 years Comparison
Arapaho
Senegalese
$44,003
HOUSEHOLDER INCOME UNDER 25 YEARS
0.0/ 100
METRIC RATING
342nd/ 347
METRIC RANK
$48,953
HOUSEHOLDER INCOME UNDER 25 YEARS
0.0/ 100
METRIC RATING
287th/ 347
METRIC RANK
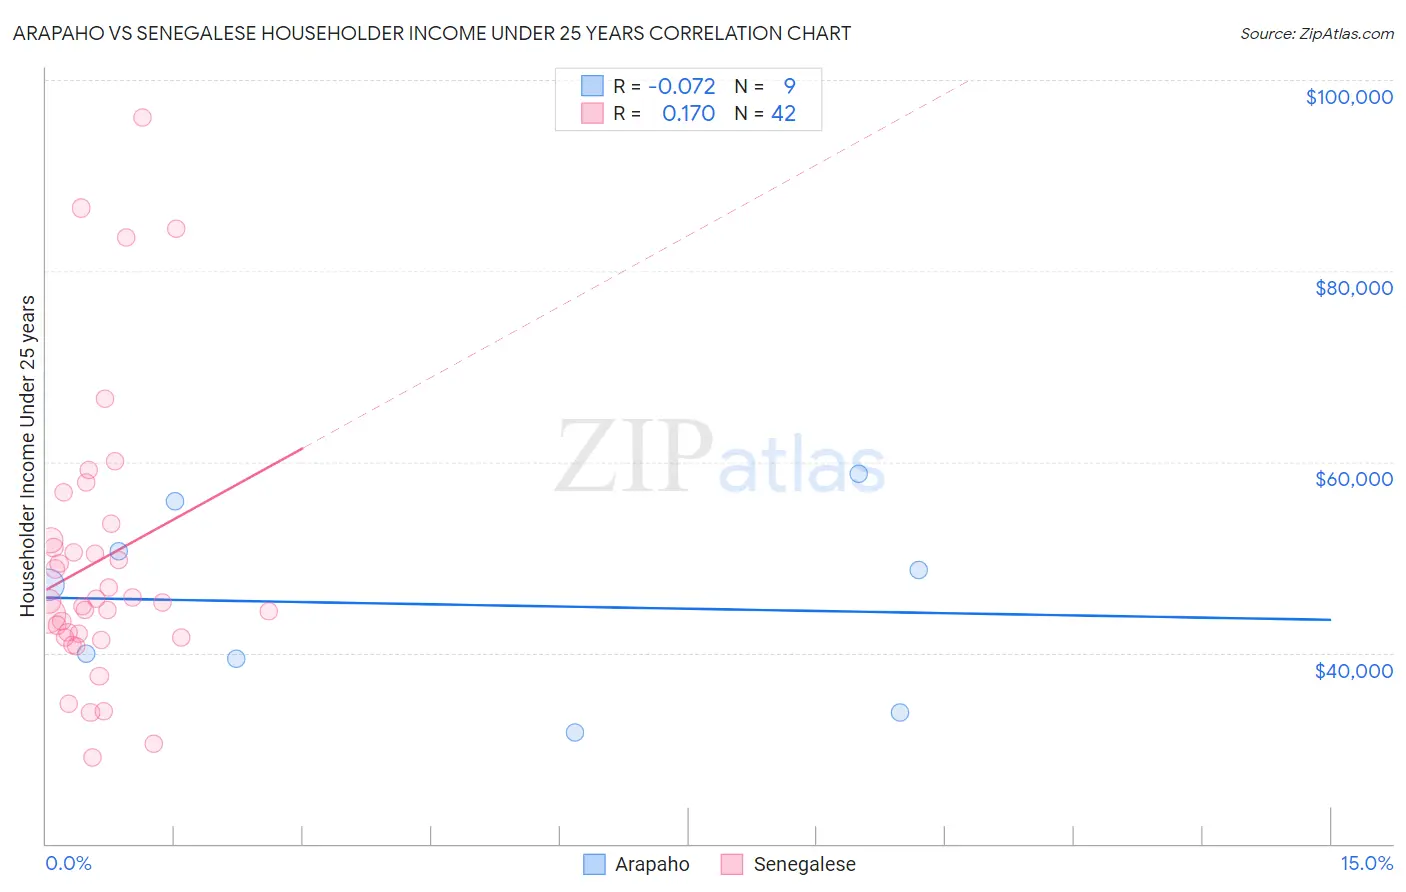
Arapaho vs Senegalese Householder Income Under 25 years Correlation Chart
The statistical analysis conducted on geographies consisting of 28,310,734 people shows a slight negative correlation between the proportion of Arapaho and household income with householder under the age of 25 in the United States with a correlation coefficient (R) of -0.072 and weighted average of $44,003. Similarly, the statistical analysis conducted on geographies consisting of 74,236,071 people shows a poor positive correlation between the proportion of Senegalese and household income with householder under the age of 25 in the United States with a correlation coefficient (R) of 0.170 and weighted average of $48,953, a difference of 11.3%.
Householder Income Under 25 years Correlation Summary
| Measurement | Arapaho | Senegalese |
| Minimum | $31,607 | $29,051 |
| Maximum | $58,750 | $96,121 |
| Range | $27,143 | $67,070 |
| Mean | $45,071 | $49,594 |
| Median | $47,132 | $45,365 |
| Interquartile 25% (IQ1) | $36,562 | $41,620 |
| Interquartile 75% (IQ3) | $53,264 | $51,815 |
| Interquartile Range (IQR) | $16,702 | $10,195 |
| Standard Deviation (Sample) | $9,498 | $14,774 |
| Standard Deviation (Population) | $8,955 | $14,597 |
Similar Demographics by Householder Income Under 25 years
Demographics Similar to Arapaho by Householder Income Under 25 years
In terms of householder income under 25 years, the demographic groups most similar to Arapaho are Houma ($44,356, a difference of 0.80%), Black/African American ($44,381, a difference of 0.86%), Immigrants from Yemen ($43,591, a difference of 0.95%), Kiowa ($44,733, a difference of 1.7%), and Immigrants from Congo ($43,266, a difference of 1.7%).
| Demographics | Rating | Rank | Householder Income Under 25 years |
| Creek | 0.0 /100 | #333 | Tragic $45,371 |
| Cajuns | 0.0 /100 | #334 | Tragic $45,338 |
| Cheyenne | 0.0 /100 | #335 | Tragic $45,275 |
| Tohono O'odham | 0.0 /100 | #336 | Tragic $45,248 |
| Pueblo | 0.0 /100 | #337 | Tragic $45,018 |
| Chickasaw | 0.0 /100 | #338 | Tragic $44,763 |
| Kiowa | 0.0 /100 | #339 | Tragic $44,733 |
| Blacks/African Americans | 0.0 /100 | #340 | Tragic $44,381 |
| Houma | 0.0 /100 | #341 | Tragic $44,356 |
| Arapaho | 0.0 /100 | #342 | Tragic $44,003 |
| Immigrants | Yemen | 0.0 /100 | #343 | Tragic $43,591 |
| Immigrants | Congo | 0.0 /100 | #344 | Tragic $43,266 |
| Navajo | 0.0 /100 | #345 | Tragic $42,380 |
| Puerto Ricans | 0.0 /100 | #346 | Tragic $39,726 |
| Lumbee | 0.0 /100 | #347 | Tragic $34,584 |
Demographics Similar to Senegalese by Householder Income Under 25 years
In terms of householder income under 25 years, the demographic groups most similar to Senegalese are French American Indian ($48,977, a difference of 0.050%), Liberian ($48,917, a difference of 0.070%), Honduran ($48,885, a difference of 0.14%), Scotch-Irish ($49,039, a difference of 0.18%), and American ($48,860, a difference of 0.19%).
| Demographics | Rating | Rank | Householder Income Under 25 years |
| Hmong | 0.1 /100 | #280 | Tragic $49,364 |
| Immigrants | Nonimmigrants | 0.1 /100 | #281 | Tragic $49,348 |
| Alsatians | 0.1 /100 | #282 | Tragic $49,267 |
| Immigrants | Nigeria | 0.1 /100 | #283 | Tragic $49,174 |
| Carpatho Rusyns | 0.1 /100 | #284 | Tragic $49,113 |
| Scotch-Irish | 0.0 /100 | #285 | Tragic $49,039 |
| French American Indians | 0.0 /100 | #286 | Tragic $48,977 |
| Senegalese | 0.0 /100 | #287 | Tragic $48,953 |
| Liberians | 0.0 /100 | #288 | Tragic $48,917 |
| Hondurans | 0.0 /100 | #289 | Tragic $48,885 |
| Americans | 0.0 /100 | #290 | Tragic $48,860 |
| Immigrants | Burma/Myanmar | 0.0 /100 | #291 | Tragic $48,749 |
| Shoshone | 0.0 /100 | #292 | Tragic $48,720 |
| Sub-Saharan Africans | 0.0 /100 | #293 | Tragic $48,691 |
| Somalis | 0.0 /100 | #294 | Tragic $48,657 |