Swiss vs Senegalese In Labor Force | Age 20-64
COMPARE
Swiss
Senegalese
In Labor Force | Age 20-64
In Labor Force | Age 20-64 Comparison
Swiss
Senegalese
79.4%
IN LABOR FORCE | AGE 20-64
28.9/ 100
METRIC RATING
191st/ 347
METRIC RANK
79.7%
IN LABOR FORCE | AGE 20-64
69.1/ 100
METRIC RATING
156th/ 347
METRIC RANK
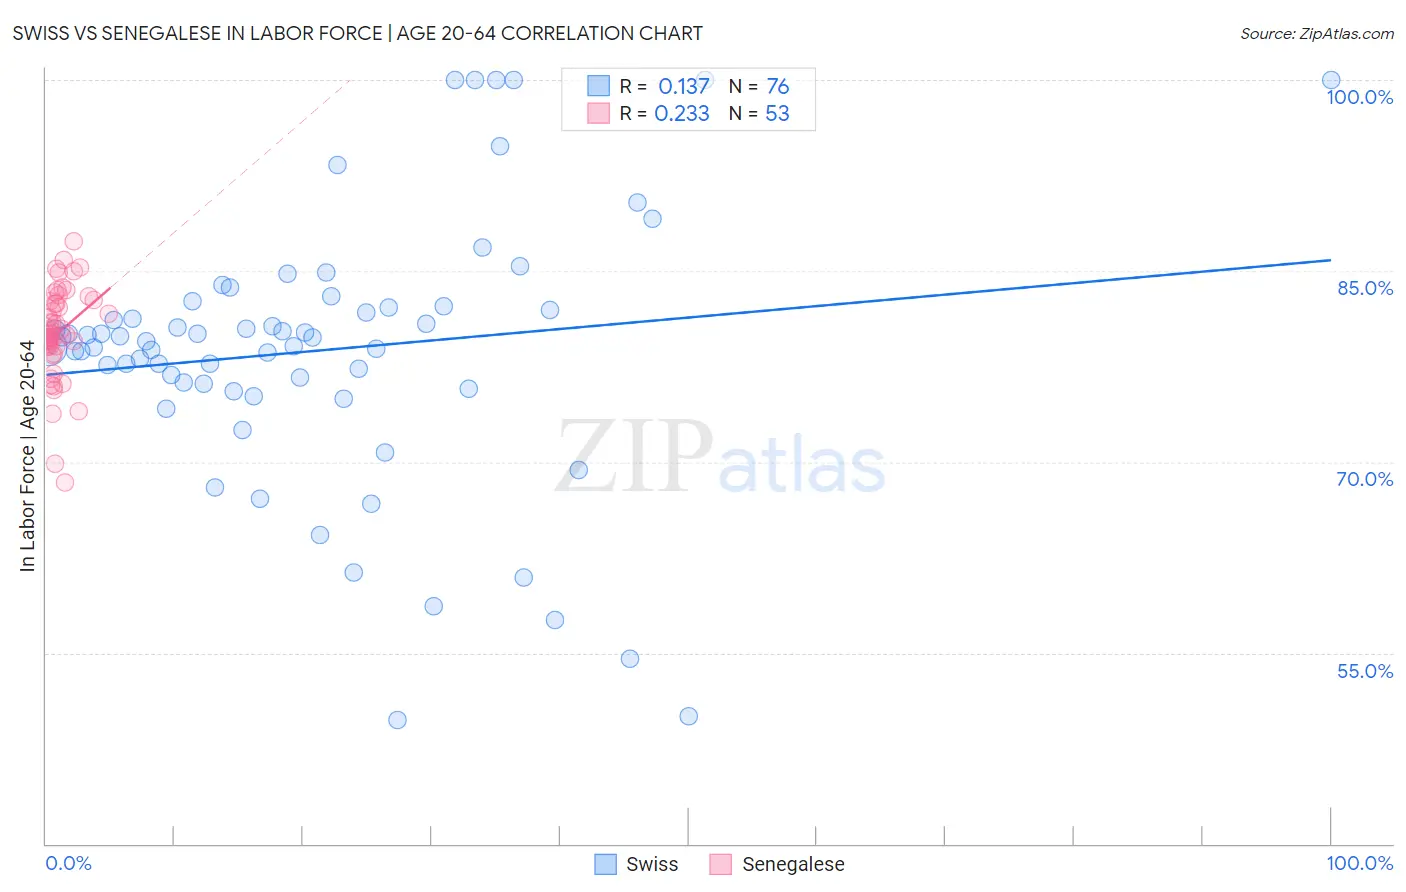
Swiss vs Senegalese In Labor Force | Age 20-64 Correlation Chart
The statistical analysis conducted on geographies consisting of 465,041,286 people shows a poor positive correlation between the proportion of Swiss and labor force participation rate among population between the ages 20 and 64 in the United States with a correlation coefficient (R) of 0.137 and weighted average of 79.4%. Similarly, the statistical analysis conducted on geographies consisting of 78,141,567 people shows a weak positive correlation between the proportion of Senegalese and labor force participation rate among population between the ages 20 and 64 in the United States with a correlation coefficient (R) of 0.233 and weighted average of 79.7%, a difference of 0.34%.
In Labor Force | Age 20-64 Correlation Summary
| Measurement | Swiss | Senegalese |
| Minimum | 49.7% | 68.4% |
| Maximum | 100.0% | 87.3% |
| Range | 50.3% | 18.9% |
| Mean | 78.8% | 80.2% |
| Median | 79.6% | 80.1% |
| Interquartile 25% (IQ1) | 76.0% | 79.0% |
| Interquartile 75% (IQ3) | 82.2% | 82.7% |
| Interquartile Range (IQR) | 6.2% | 3.6% |
| Standard Deviation (Sample) | 10.6% | 3.7% |
| Standard Deviation (Population) | 10.5% | 3.7% |
Similar Demographics by In Labor Force | Age 20-64
Demographics Similar to Swiss by In Labor Force | Age 20-64
In terms of in labor force | age 20-64, the demographic groups most similar to Swiss are Immigrants from El Salvador (79.4%, a difference of 0.020%), Immigrants from Syria (79.4%, a difference of 0.020%), Immigrants from Denmark (79.4%, a difference of 0.020%), Immigrants from Haiti (79.4%, a difference of 0.030%), and Indonesian (79.4%, a difference of 0.030%).
| Demographics | Rating | Rank | In Labor Force | Age 20-64 |
| Finns | 35.9 /100 | #184 | Fair 79.5% |
| Israelis | 34.7 /100 | #185 | Fair 79.5% |
| Northern Europeans | 34.5 /100 | #186 | Fair 79.5% |
| Assyrians/Chaldeans/Syriacs | 33.3 /100 | #187 | Fair 79.4% |
| Immigrants | Haiti | 32.1 /100 | #188 | Fair 79.4% |
| Immigrants | El Salvador | 30.9 /100 | #189 | Fair 79.4% |
| Immigrants | Syria | 30.8 /100 | #190 | Fair 79.4% |
| Swiss | 28.9 /100 | #191 | Fair 79.4% |
| Immigrants | Denmark | 26.9 /100 | #192 | Fair 79.4% |
| Indonesians | 26.1 /100 | #193 | Fair 79.4% |
| Immigrants | Thailand | 24.8 /100 | #194 | Fair 79.4% |
| Immigrants | Austria | 23.7 /100 | #195 | Fair 79.4% |
| Ecuadorians | 23.1 /100 | #196 | Fair 79.4% |
| Immigrants | Senegal | 22.5 /100 | #197 | Fair 79.4% |
| Immigrants | Laos | 21.5 /100 | #198 | Fair 79.4% |
Demographics Similar to Senegalese by In Labor Force | Age 20-64
In terms of in labor force | age 20-64, the demographic groups most similar to Senegalese are Immigrants from Kazakhstan (79.7%, a difference of 0.0%), New Zealander (79.7%, a difference of 0.0%), Immigrants from South Africa (79.7%, a difference of 0.0%), Immigrants from China (79.7%, a difference of 0.0%), and Austrian (79.7%, a difference of 0.010%).
| Demographics | Rating | Rank | In Labor Force | Age 20-64 |
| Icelanders | 75.1 /100 | #149 | Good 79.7% |
| Costa Ricans | 72.4 /100 | #150 | Good 79.7% |
| Scandinavians | 72.0 /100 | #151 | Good 79.7% |
| Immigrants | Northern Europe | 72.0 /100 | #152 | Good 79.7% |
| Immigrants | Kazakhstan | 69.5 /100 | #153 | Good 79.7% |
| New Zealanders | 69.4 /100 | #154 | Good 79.7% |
| Immigrants | South Africa | 69.2 /100 | #155 | Good 79.7% |
| Senegalese | 69.1 /100 | #156 | Good 79.7% |
| Immigrants | China | 69.1 /100 | #157 | Good 79.7% |
| Austrians | 67.6 /100 | #158 | Good 79.7% |
| Immigrants | Cuba | 66.7 /100 | #159 | Good 79.7% |
| Moroccans | 66.7 /100 | #160 | Good 79.7% |
| South Africans | 66.2 /100 | #161 | Good 79.7% |
| Germans | 65.2 /100 | #162 | Good 79.7% |
| Immigrants | Costa Rica | 64.6 /100 | #163 | Good 79.7% |