Arapaho vs Peruvian In Labor Force | Age 20-64
COMPARE
Arapaho
Peruvian
In Labor Force | Age 20-64
In Labor Force | Age 20-64 Comparison
Arapaho
Peruvians
74.4%
IN LABOR FORCE | AGE 20-64
0.0/ 100
METRIC RATING
332nd/ 347
METRIC RANK
80.3%
IN LABOR FORCE | AGE 20-64
99.1/ 100
METRIC RATING
54th/ 347
METRIC RANK
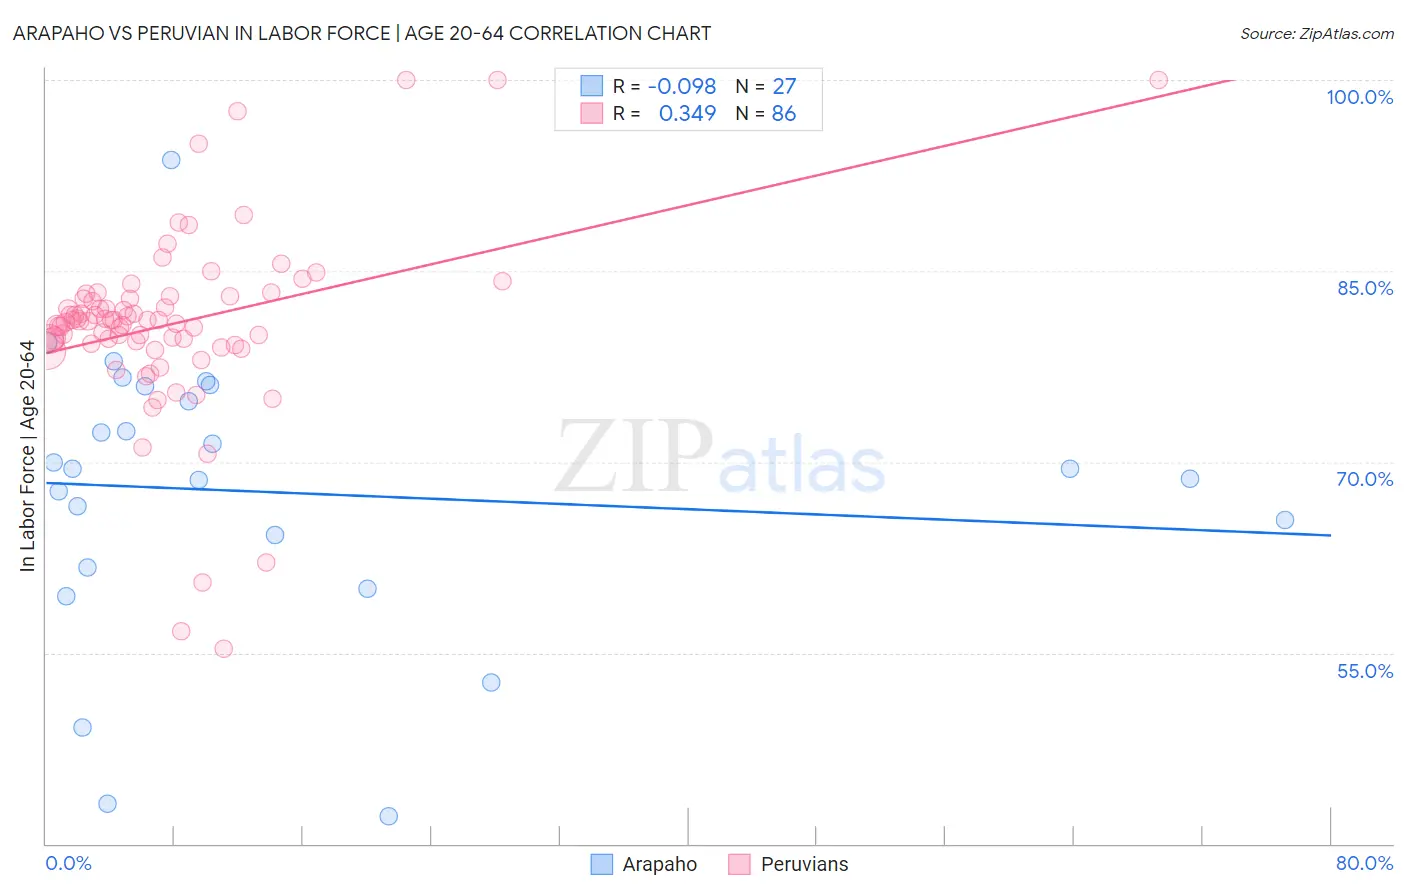
Arapaho vs Peruvian In Labor Force | Age 20-64 Correlation Chart
The statistical analysis conducted on geographies consisting of 29,780,325 people shows a slight negative correlation between the proportion of Arapaho and labor force participation rate among population between the ages 20 and 64 in the United States with a correlation coefficient (R) of -0.098 and weighted average of 74.4%. Similarly, the statistical analysis conducted on geographies consisting of 363,253,233 people shows a mild positive correlation between the proportion of Peruvians and labor force participation rate among population between the ages 20 and 64 in the United States with a correlation coefficient (R) of 0.349 and weighted average of 80.3%, a difference of 8.0%.
In Labor Force | Age 20-64 Correlation Summary
| Measurement | Arapaho | Peruvian |
| Minimum | 42.2% | 55.3% |
| Maximum | 93.7% | 100.0% |
| Range | 51.5% | 44.7% |
| Mean | 67.6% | 80.8% |
| Median | 69.5% | 81.1% |
| Interquartile 25% (IQ1) | 61.7% | 79.2% |
| Interquartile 75% (IQ3) | 75.9% | 82.8% |
| Interquartile Range (IQR) | 14.2% | 3.6% |
| Standard Deviation (Sample) | 11.3% | 7.2% |
| Standard Deviation (Population) | 11.1% | 7.2% |
Similar Demographics by In Labor Force | Age 20-64
Demographics Similar to Arapaho by In Labor Force | Age 20-64
In terms of in labor force | age 20-64, the demographic groups most similar to Arapaho are Paiute (74.7%, a difference of 0.40%), Colville (74.8%, a difference of 0.54%), Cheyenne (74.8%, a difference of 0.60%), Native/Alaskan (73.9%, a difference of 0.66%), and Kiowa (75.0%, a difference of 0.80%).
| Demographics | Rating | Rank | In Labor Force | Age 20-64 |
| Menominee | 0.0 /100 | #325 | Tragic 75.3% |
| Creek | 0.0 /100 | #326 | Tragic 75.1% |
| Sioux | 0.0 /100 | #327 | Tragic 75.0% |
| Kiowa | 0.0 /100 | #328 | Tragic 75.0% |
| Cheyenne | 0.0 /100 | #329 | Tragic 74.8% |
| Colville | 0.0 /100 | #330 | Tragic 74.8% |
| Paiute | 0.0 /100 | #331 | Tragic 74.7% |
| Arapaho | 0.0 /100 | #332 | Tragic 74.4% |
| Natives/Alaskans | 0.0 /100 | #333 | Tragic 73.9% |
| Apache | 0.0 /100 | #334 | Tragic 73.7% |
| Ute | 0.0 /100 | #335 | Tragic 73.7% |
| Crow | 0.0 /100 | #336 | Tragic 73.3% |
| Yup'ik | 0.0 /100 | #337 | Tragic 73.2% |
| Puerto Ricans | 0.0 /100 | #338 | Tragic 73.1% |
| Houma | 0.0 /100 | #339 | Tragic 72.7% |
Demographics Similar to Peruvians by In Labor Force | Age 20-64
In terms of in labor force | age 20-64, the demographic groups most similar to Peruvians are Immigrants from Peru (80.3%, a difference of 0.010%), Immigrants from Cabo Verde (80.3%, a difference of 0.020%), Turkish (80.3%, a difference of 0.030%), Immigrants from Sri Lanka (80.4%, a difference of 0.040%), and Immigrants from Northern Africa (80.3%, a difference of 0.040%).
| Demographics | Rating | Rank | In Labor Force | Age 20-64 |
| Immigrants | Africa | 99.6 /100 | #47 | Exceptional 80.4% |
| Immigrants | Hong Kong | 99.5 /100 | #48 | Exceptional 80.4% |
| Immigrants | Greece | 99.4 /100 | #49 | Exceptional 80.4% |
| Immigrants | Sudan | 99.4 /100 | #50 | Exceptional 80.4% |
| Immigrants | Sri Lanka | 99.3 /100 | #51 | Exceptional 80.4% |
| Turks | 99.2 /100 | #52 | Exceptional 80.3% |
| Immigrants | Peru | 99.2 /100 | #53 | Exceptional 80.3% |
| Peruvians | 99.1 /100 | #54 | Exceptional 80.3% |
| Immigrants | Cabo Verde | 99.0 /100 | #55 | Exceptional 80.3% |
| Immigrants | Northern Africa | 99.0 /100 | #56 | Exceptional 80.3% |
| Afghans | 98.9 /100 | #57 | Exceptional 80.3% |
| Serbians | 98.9 /100 | #58 | Exceptional 80.3% |
| Swedes | 98.9 /100 | #59 | Exceptional 80.3% |
| Tongans | 98.8 /100 | #60 | Exceptional 80.3% |
| Burmese | 98.8 /100 | #61 | Exceptional 80.3% |