Arab vs Armenian Vision Disability
COMPARE
Arab
Armenian
Vision Disability
Vision Disability Comparison
Arabs
Armenians
2.1%
VISION DISABILITY
86.3/ 100
METRIC RATING
138th/ 347
METRIC RANK
2.0%
VISION DISABILITY
99.0/ 100
METRIC RATING
63rd/ 347
METRIC RANK
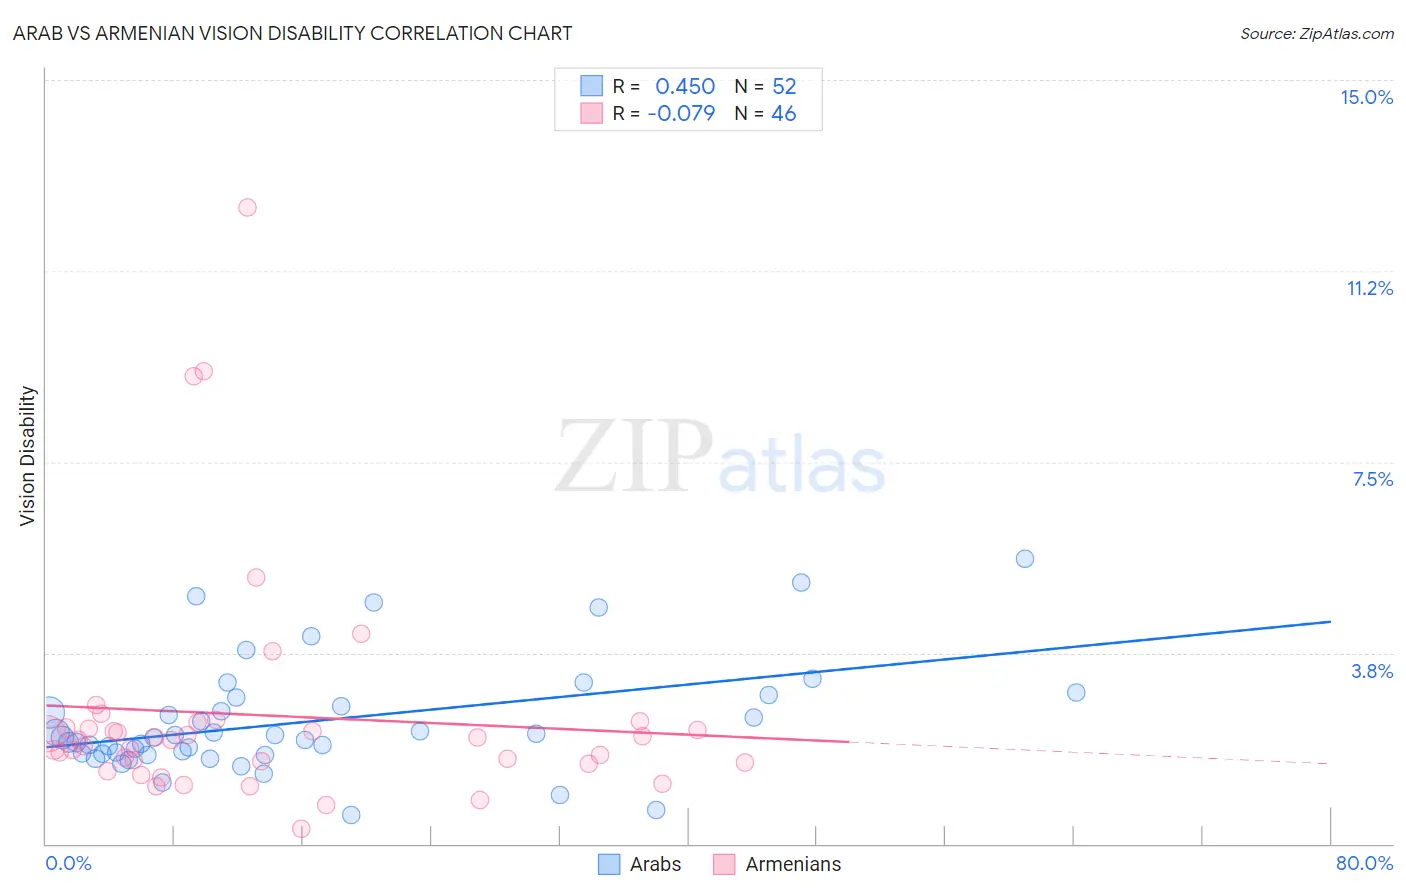
Arab vs Armenian Vision Disability Correlation Chart
The statistical analysis conducted on geographies consisting of 486,276,128 people shows a moderate positive correlation between the proportion of Arabs and percentage of population with vision disability in the United States with a correlation coefficient (R) of 0.450 and weighted average of 2.1%. Similarly, the statistical analysis conducted on geographies consisting of 310,763,377 people shows a slight negative correlation between the proportion of Armenians and percentage of population with vision disability in the United States with a correlation coefficient (R) of -0.079 and weighted average of 2.0%, a difference of 4.8%.
Vision Disability Correlation Summary
| Measurement | Arab | Armenian |
| Minimum | 0.55% | 0.29% |
| Maximum | 5.6% | 12.5% |
| Range | 5.1% | 12.2% |
| Mean | 2.4% | 2.5% |
| Median | 2.1% | 2.0% |
| Interquartile 25% (IQ1) | 1.8% | 1.6% |
| Interquartile 75% (IQ3) | 2.8% | 2.3% |
| Interquartile Range (IQR) | 1.0% | 0.68% |
| Standard Deviation (Sample) | 1.1% | 2.3% |
| Standard Deviation (Population) | 1.1% | 2.3% |
Similar Demographics by Vision Disability
Demographics Similar to Arabs by Vision Disability
In terms of vision disability, the demographic groups most similar to Arabs are Czech (2.1%, a difference of 0.010%), Immigrants from South Eastern Asia (2.1%, a difference of 0.010%), Vietnamese (2.1%, a difference of 0.060%), Venezuelan (2.1%, a difference of 0.13%), and Immigrants from Morocco (2.1%, a difference of 0.14%).
| Demographics | Rating | Rank | Vision Disability |
| Immigrants | Hungary | 88.7 /100 | #131 | Excellent 2.1% |
| New Zealanders | 88.2 /100 | #132 | Excellent 2.1% |
| Syrians | 87.5 /100 | #133 | Excellent 2.1% |
| Venezuelans | 87.2 /100 | #134 | Excellent 2.1% |
| Vietnamese | 86.7 /100 | #135 | Excellent 2.1% |
| Czechs | 86.3 /100 | #136 | Excellent 2.1% |
| Immigrants | South Eastern Asia | 86.3 /100 | #137 | Excellent 2.1% |
| Arabs | 86.3 /100 | #138 | Excellent 2.1% |
| Immigrants | Morocco | 85.2 /100 | #139 | Excellent 2.1% |
| Immigrants | Netherlands | 84.2 /100 | #140 | Excellent 2.1% |
| Sierra Leoneans | 84.1 /100 | #141 | Excellent 2.1% |
| South Americans | 82.8 /100 | #142 | Excellent 2.1% |
| Immigrants | Sierra Leone | 82.8 /100 | #143 | Excellent 2.1% |
| Ukrainians | 81.9 /100 | #144 | Excellent 2.1% |
| Immigrants | Bosnia and Herzegovina | 81.5 /100 | #145 | Excellent 2.1% |
Demographics Similar to Armenians by Vision Disability
In terms of vision disability, the demographic groups most similar to Armenians are Immigrants from Russia (2.0%, a difference of 0.11%), Immigrants from Belgium (2.0%, a difference of 0.13%), Immigrants from Greece (2.0%, a difference of 0.13%), Immigrants from Romania (2.0%, a difference of 0.15%), and Argentinean (2.0%, a difference of 0.17%).
| Demographics | Rating | Rank | Vision Disability |
| Jordanians | 99.2 /100 | #56 | Exceptional 2.0% |
| Somalis | 99.2 /100 | #57 | Exceptional 2.0% |
| Immigrants | Saudi Arabia | 99.2 /100 | #58 | Exceptional 2.0% |
| Argentineans | 99.1 /100 | #59 | Exceptional 2.0% |
| Immigrants | Romania | 99.1 /100 | #60 | Exceptional 2.0% |
| Immigrants | Belgium | 99.1 /100 | #61 | Exceptional 2.0% |
| Immigrants | Russia | 99.1 /100 | #62 | Exceptional 2.0% |
| Armenians | 99.0 /100 | #63 | Exceptional 2.0% |
| Immigrants | Greece | 99.0 /100 | #64 | Exceptional 2.0% |
| Maltese | 98.9 /100 | #65 | Exceptional 2.0% |
| Immigrants | Argentina | 98.9 /100 | #66 | Exceptional 2.0% |
| Immigrants | Northern Africa | 98.8 /100 | #67 | Exceptional 2.0% |
| Immigrants | Czechoslovakia | 98.7 /100 | #68 | Exceptional 2.0% |
| Russians | 98.6 /100 | #69 | Exceptional 2.0% |
| Immigrants | Kazakhstan | 98.6 /100 | #70 | Exceptional 2.0% |