Apache vs Panamanian In Labor Force | Age 16-19
COMPARE
Apache
Panamanian
In Labor Force | Age 16-19
In Labor Force | Age 16-19 Comparison
Apache
Panamanians
35.6%
IN LABOR FORCE | AGE 16-19
11.0/ 100
METRIC RATING
214th/ 347
METRIC RANK
36.1%
IN LABOR FORCE | AGE 16-19
28.6/ 100
METRIC RATING
190th/ 347
METRIC RANK
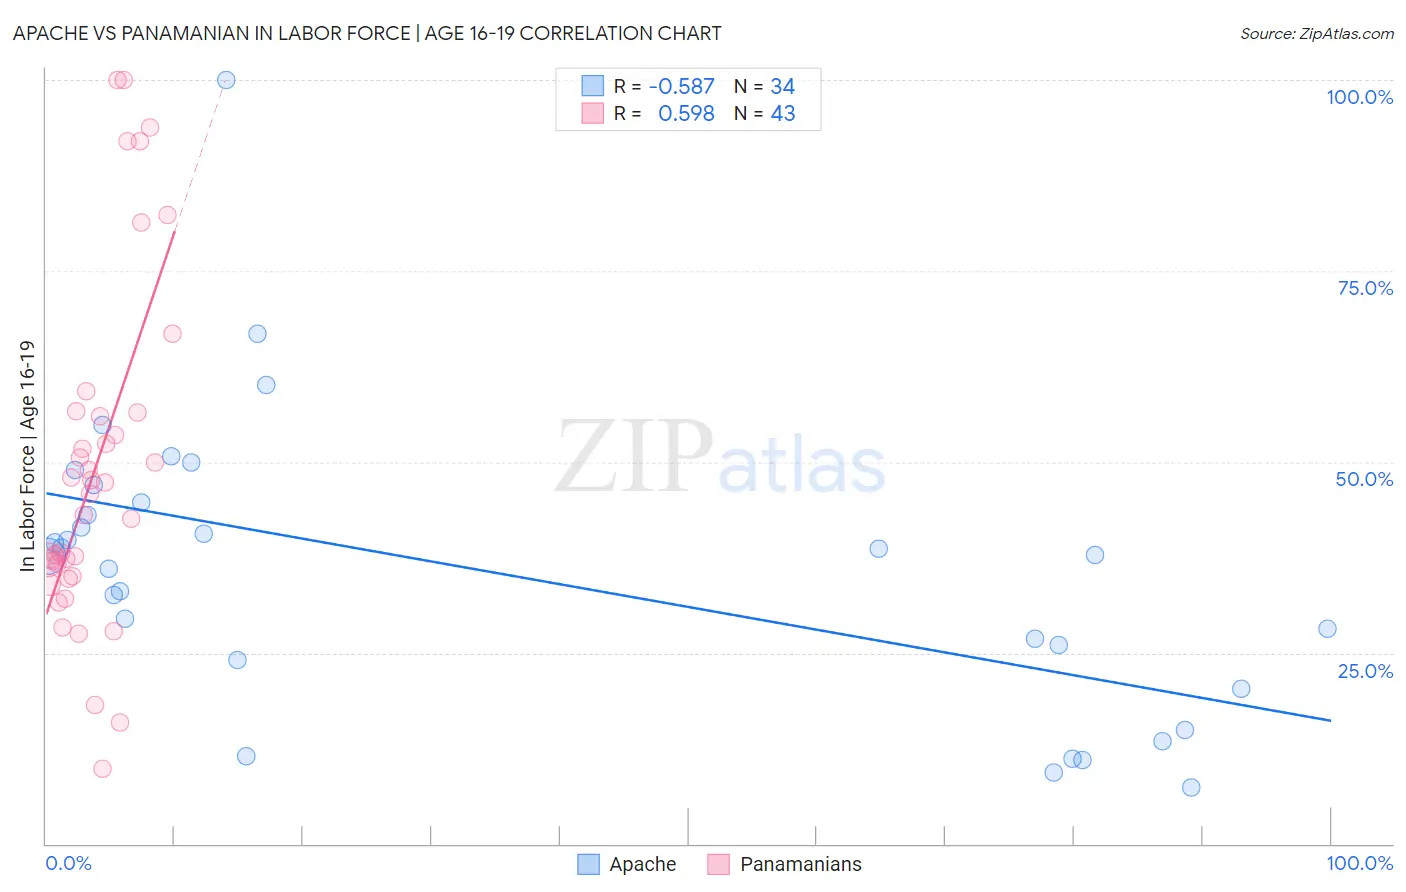
Apache vs Panamanian In Labor Force | Age 16-19 Correlation Chart
The statistical analysis conducted on geographies consisting of 230,841,914 people shows a substantial negative correlation between the proportion of Apache and labor force participation rate among population between the ages 16 and 19 in the United States with a correlation coefficient (R) of -0.587 and weighted average of 35.6%. Similarly, the statistical analysis conducted on geographies consisting of 281,056,655 people shows a substantial positive correlation between the proportion of Panamanians and labor force participation rate among population between the ages 16 and 19 in the United States with a correlation coefficient (R) of 0.598 and weighted average of 36.1%, a difference of 1.5%.
In Labor Force | Age 16-19 Correlation Summary
| Measurement | Apache | Panamanian |
| Minimum | 7.4% | 9.9% |
| Maximum | 100.0% | 100.0% |
| Range | 92.6% | 90.1% |
| Mean | 35.7% | 49.1% |
| Median | 37.7% | 45.8% |
| Interquartile 25% (IQ1) | 24.0% | 35.1% |
| Interquartile 75% (IQ3) | 44.6% | 56.4% |
| Interquartile Range (IQR) | 20.6% | 21.3% |
| Standard Deviation (Sample) | 19.0% | 22.4% |
| Standard Deviation (Population) | 18.7% | 22.1% |
Similar Demographics by In Labor Force | Age 16-19
Demographics Similar to Apache by In Labor Force | Age 16-19
In terms of in labor force | age 16-19, the demographic groups most similar to Apache are Houma (35.6%, a difference of 0.010%), Immigrants from Bolivia (35.6%, a difference of 0.010%), Immigrants from South Eastern Asia (35.6%, a difference of 0.020%), Dutch West Indian (35.6%, a difference of 0.040%), and Immigrants from Costa Rica (35.6%, a difference of 0.040%).
| Demographics | Rating | Rank | In Labor Force | Age 16-19 |
| Immigrants | Eastern Europe | 14.5 /100 | #207 | Poor 35.8% |
| Koreans | 13.3 /100 | #208 | Poor 35.7% |
| Moroccans | 12.7 /100 | #209 | Poor 35.7% |
| Immigrants | Switzerland | 11.9 /100 | #210 | Poor 35.6% |
| Mexicans | 11.9 /100 | #211 | Poor 35.6% |
| Houma | 11.0 /100 | #212 | Poor 35.6% |
| Immigrants | Bolivia | 11.0 /100 | #213 | Poor 35.6% |
| Apache | 11.0 /100 | #214 | Poor 35.6% |
| Immigrants | South Eastern Asia | 10.8 /100 | #215 | Poor 35.6% |
| Dutch West Indians | 10.7 /100 | #216 | Poor 35.6% |
| Immigrants | Costa Rica | 10.7 /100 | #217 | Poor 35.6% |
| Sri Lankans | 9.8 /100 | #218 | Tragic 35.5% |
| Guatemalans | 8.6 /100 | #219 | Tragic 35.5% |
| Immigrants | Bahamas | 8.3 /100 | #220 | Tragic 35.5% |
| Turks | 7.3 /100 | #221 | Tragic 35.4% |
Demographics Similar to Panamanians by In Labor Force | Age 16-19
In terms of in labor force | age 16-19, the demographic groups most similar to Panamanians are Immigrants from Hungary (36.2%, a difference of 0.010%), Immigrants from Croatia (36.1%, a difference of 0.070%), Immigrants from Europe (36.2%, a difference of 0.19%), Afghan (36.1%, a difference of 0.19%), and Immigrants from Denmark (36.1%, a difference of 0.23%).
| Demographics | Rating | Rank | In Labor Force | Age 16-19 |
| Eastern Europeans | 38.8 /100 | #183 | Fair 36.4% |
| Costa Ricans | 36.1 /100 | #184 | Fair 36.3% |
| Bhutanese | 35.3 /100 | #185 | Fair 36.3% |
| Immigrants | Romania | 34.0 /100 | #186 | Fair 36.3% |
| Immigrants | Afghanistan | 34.0 /100 | #187 | Fair 36.3% |
| Immigrants | Europe | 31.8 /100 | #188 | Fair 36.2% |
| Immigrants | Hungary | 28.8 /100 | #189 | Fair 36.2% |
| Panamanians | 28.6 /100 | #190 | Fair 36.1% |
| Immigrants | Croatia | 27.5 /100 | #191 | Fair 36.1% |
| Afghans | 25.7 /100 | #192 | Fair 36.1% |
| Immigrants | Denmark | 25.0 /100 | #193 | Fair 36.1% |
| Nigerians | 24.6 /100 | #194 | Fair 36.1% |
| Bolivians | 23.3 /100 | #195 | Fair 36.0% |
| Mexican American Indians | 21.1 /100 | #196 | Fair 36.0% |
| Immigrants | Serbia | 21.0 /100 | #197 | Fair 36.0% |