Apache vs Okinawan In Labor Force | Age 20-24
COMPARE
Apache
Okinawan
In Labor Force | Age 20-24
In Labor Force | Age 20-24 Comparison
Apache
Okinawans
72.0%
IN LABOR FORCE | AGE 20-24
0.0/ 100
METRIC RATING
311th/ 347
METRIC RANK
72.7%
IN LABOR FORCE | AGE 20-24
0.0/ 100
METRIC RATING
295th/ 347
METRIC RANK
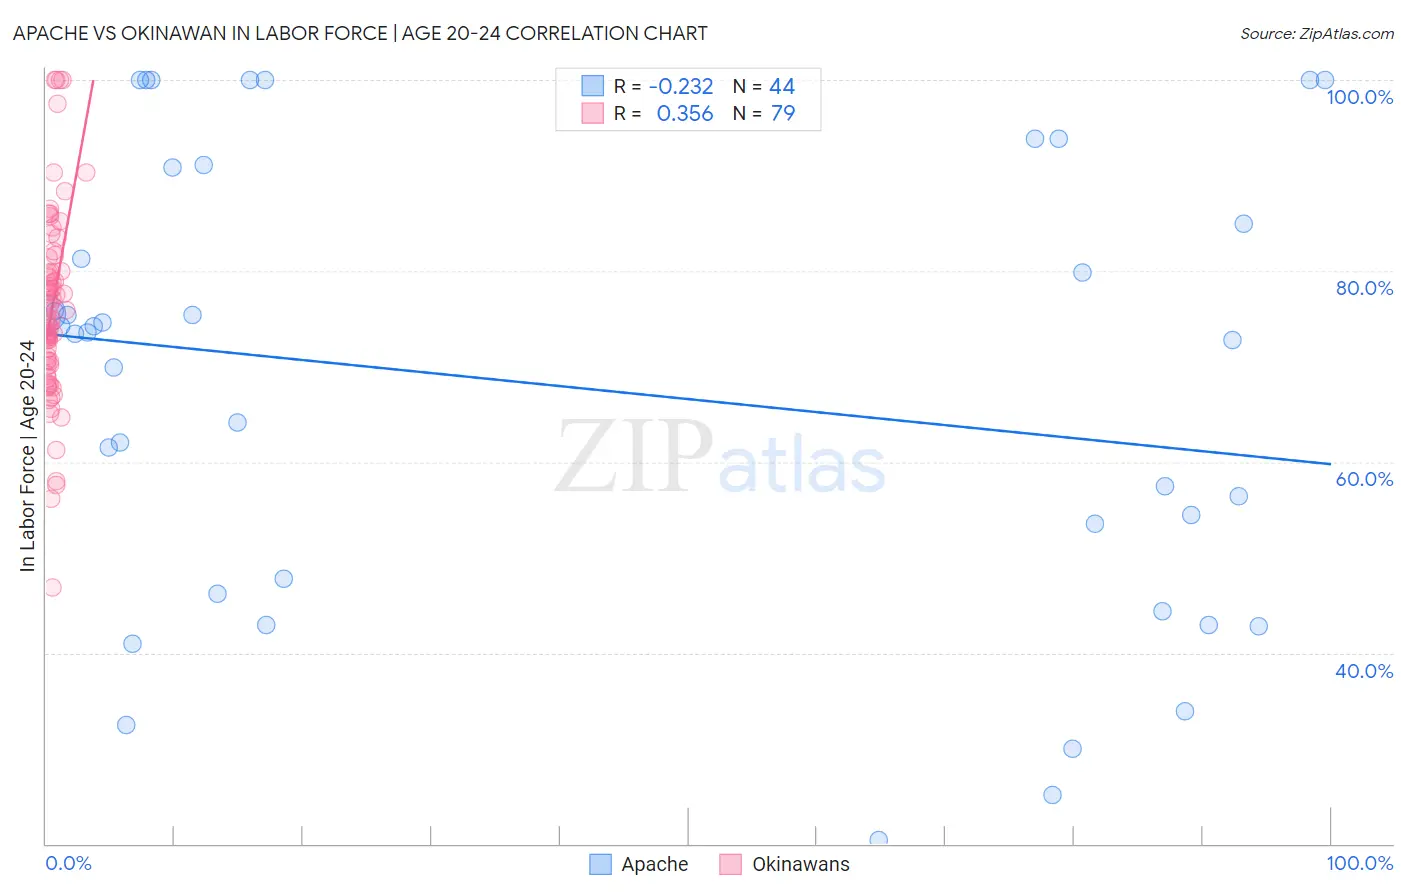
Apache vs Okinawan In Labor Force | Age 20-24 Correlation Chart
The statistical analysis conducted on geographies consisting of 231,058,831 people shows a weak negative correlation between the proportion of Apache and labor force participation rate among population between the ages 20 and 24 in the United States with a correlation coefficient (R) of -0.232 and weighted average of 72.0%. Similarly, the statistical analysis conducted on geographies consisting of 73,779,368 people shows a mild positive correlation between the proportion of Okinawans and labor force participation rate among population between the ages 20 and 24 in the United States with a correlation coefficient (R) of 0.356 and weighted average of 72.7%, a difference of 1.0%.
In Labor Force | Age 20-24 Correlation Summary
| Measurement | Apache | Okinawan |
| Minimum | 20.4% | 46.9% |
| Maximum | 100.0% | 100.0% |
| Range | 79.6% | 53.1% |
| Mean | 67.9% | 76.0% |
| Median | 73.5% | 75.0% |
| Interquartile 25% (IQ1) | 47.0% | 70.2% |
| Interquartile 75% (IQ3) | 87.9% | 80.0% |
| Interquartile Range (IQR) | 40.9% | 9.8% |
| Standard Deviation (Sample) | 23.3% | 9.9% |
| Standard Deviation (Population) | 23.1% | 9.9% |
Demographics Similar to Apache and Okinawans by In Labor Force | Age 20-24
In terms of in labor force | age 20-24, the demographic groups most similar to Apache are Immigrants from Cuba (72.0%, a difference of 0.010%), Immigrants from Caribbean (71.9%, a difference of 0.070%), Immigrants from Dominica (71.9%, a difference of 0.12%), Soviet Union (72.3%, a difference of 0.39%), and Tsimshian (72.3%, a difference of 0.39%). Similarly, the demographic groups most similar to Okinawans are Jamaican (72.7%, a difference of 0.0%), Central American Indian (72.7%, a difference of 0.050%), Immigrants from Argentina (72.8%, a difference of 0.11%), Immigrants from Belize (72.8%, a difference of 0.14%), and Israeli (72.6%, a difference of 0.18%).
| Demographics | Rating | Rank | In Labor Force | Age 20-24 |
| Immigrants | Belize | 0.0 /100 | #293 | Tragic 72.8% |
| Immigrants | Argentina | 0.0 /100 | #294 | Tragic 72.8% |
| Okinawans | 0.0 /100 | #295 | Tragic 72.7% |
| Jamaicans | 0.0 /100 | #296 | Tragic 72.7% |
| Central American Indians | 0.0 /100 | #297 | Tragic 72.7% |
| Israelis | 0.0 /100 | #298 | Tragic 72.6% |
| Iranians | 0.0 /100 | #299 | Tragic 72.6% |
| Armenians | 0.0 /100 | #300 | Tragic 72.5% |
| Cubans | 0.0 /100 | #301 | Tragic 72.5% |
| Natives/Alaskans | 0.0 /100 | #302 | Tragic 72.4% |
| Ecuadorians | 0.0 /100 | #303 | Tragic 72.4% |
| Immigrants | West Indies | 0.0 /100 | #304 | Tragic 72.4% |
| Immigrants | Singapore | 0.0 /100 | #305 | Tragic 72.4% |
| Immigrants | Jamaica | 0.0 /100 | #306 | Tragic 72.4% |
| Immigrants | Ecuador | 0.0 /100 | #307 | Tragic 72.3% |
| Soviet Union | 0.0 /100 | #308 | Tragic 72.3% |
| Tsimshian | 0.0 /100 | #309 | Tragic 72.3% |
| Immigrants | Cuba | 0.0 /100 | #310 | Tragic 72.0% |
| Apache | 0.0 /100 | #311 | Tragic 72.0% |
| Immigrants | Caribbean | 0.0 /100 | #312 | Tragic 71.9% |
| Immigrants | Dominica | 0.0 /100 | #313 | Tragic 71.9% |