Apache vs Immigrants from Latvia In Labor Force | Age 20-64
COMPARE
Apache
Immigrants from Latvia
In Labor Force | Age 20-64
In Labor Force | Age 20-64 Comparison
Apache
Immigrants from Latvia
73.7%
IN LABOR FORCE | AGE 20-64
0.0/ 100
METRIC RATING
334th/ 347
METRIC RANK
80.1%
IN LABOR FORCE | AGE 20-64
97.2/ 100
METRIC RATING
84th/ 347
METRIC RANK
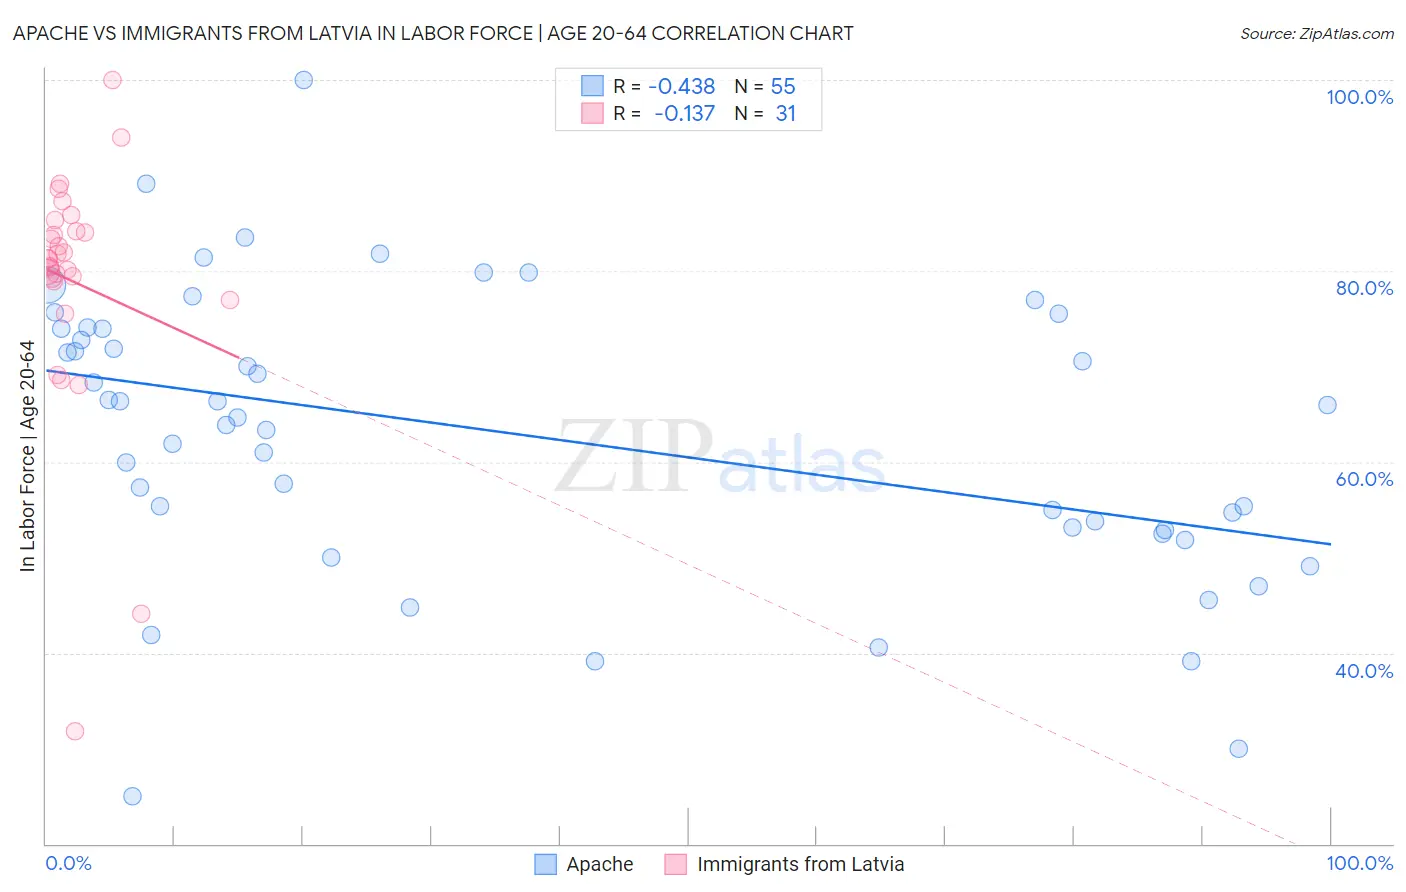
Apache vs Immigrants from Latvia In Labor Force | Age 20-64 Correlation Chart
The statistical analysis conducted on geographies consisting of 231,122,783 people shows a moderate negative correlation between the proportion of Apache and labor force participation rate among population between the ages 20 and 64 in the United States with a correlation coefficient (R) of -0.438 and weighted average of 73.7%. Similarly, the statistical analysis conducted on geographies consisting of 113,735,345 people shows a poor negative correlation between the proportion of Immigrants from Latvia and labor force participation rate among population between the ages 20 and 64 in the United States with a correlation coefficient (R) of -0.137 and weighted average of 80.1%, a difference of 8.7%.
In Labor Force | Age 20-64 Correlation Summary
| Measurement | Apache | Immigrants from Latvia |
| Minimum | 25.0% | 31.8% |
| Maximum | 100.0% | 100.0% |
| Range | 75.0% | 68.2% |
| Mean | 62.9% | 78.9% |
| Median | 64.7% | 81.3% |
| Interquartile 25% (IQ1) | 52.8% | 78.9% |
| Interquartile 75% (IQ3) | 74.0% | 84.2% |
| Interquartile Range (IQR) | 21.2% | 5.3% |
| Standard Deviation (Sample) | 15.1% | 12.8% |
| Standard Deviation (Population) | 15.0% | 12.6% |
Similar Demographics by In Labor Force | Age 20-64
Demographics Similar to Apache by In Labor Force | Age 20-64
In terms of in labor force | age 20-64, the demographic groups most similar to Apache are Ute (73.7%, a difference of 0.020%), Native/Alaskan (73.9%, a difference of 0.30%), Crow (73.3%, a difference of 0.52%), Yup'ik (73.2%, a difference of 0.64%), and Puerto Rican (73.1%, a difference of 0.85%).
| Demographics | Rating | Rank | In Labor Force | Age 20-64 |
| Sioux | 0.0 /100 | #327 | Tragic 75.0% |
| Kiowa | 0.0 /100 | #328 | Tragic 75.0% |
| Cheyenne | 0.0 /100 | #329 | Tragic 74.8% |
| Colville | 0.0 /100 | #330 | Tragic 74.8% |
| Paiute | 0.0 /100 | #331 | Tragic 74.7% |
| Arapaho | 0.0 /100 | #332 | Tragic 74.4% |
| Natives/Alaskans | 0.0 /100 | #333 | Tragic 73.9% |
| Apache | 0.0 /100 | #334 | Tragic 73.7% |
| Ute | 0.0 /100 | #335 | Tragic 73.7% |
| Crow | 0.0 /100 | #336 | Tragic 73.3% |
| Yup'ik | 0.0 /100 | #337 | Tragic 73.2% |
| Puerto Ricans | 0.0 /100 | #338 | Tragic 73.1% |
| Houma | 0.0 /100 | #339 | Tragic 72.7% |
| Pueblo | 0.0 /100 | #340 | Tragic 72.6% |
| Immigrants | Yemen | 0.0 /100 | #341 | Tragic 72.3% |
Demographics Similar to Immigrants from Latvia by In Labor Force | Age 20-64
In terms of in labor force | age 20-64, the demographic groups most similar to Immigrants from Latvia are Colombian (80.1%, a difference of 0.0%), German Russian (80.1%, a difference of 0.010%), Immigrants from Japan (80.1%, a difference of 0.010%), Jordanian (80.1%, a difference of 0.010%), and Immigrants from Egypt (80.1%, a difference of 0.010%).
| Demographics | Rating | Rank | In Labor Force | Age 20-64 |
| Immigrants | Colombia | 97.8 /100 | #77 | Exceptional 80.2% |
| Immigrants | Romania | 97.8 /100 | #78 | Exceptional 80.2% |
| Asians | 97.7 /100 | #79 | Exceptional 80.2% |
| Immigrants | Croatia | 97.6 /100 | #80 | Exceptional 80.1% |
| German Russians | 97.3 /100 | #81 | Exceptional 80.1% |
| Immigrants | Japan | 97.3 /100 | #82 | Exceptional 80.1% |
| Colombians | 97.3 /100 | #83 | Exceptional 80.1% |
| Immigrants | Latvia | 97.2 /100 | #84 | Exceptional 80.1% |
| Jordanians | 97.2 /100 | #85 | Exceptional 80.1% |
| Immigrants | Egypt | 97.1 /100 | #86 | Exceptional 80.1% |
| Croatians | 97.1 /100 | #87 | Exceptional 80.1% |
| Chileans | 97.0 /100 | #88 | Exceptional 80.1% |
| Immigrants | Venezuela | 96.8 /100 | #89 | Exceptional 80.1% |
| Poles | 96.8 /100 | #90 | Exceptional 80.1% |
| Uruguayans | 96.7 /100 | #91 | Exceptional 80.1% |