Apache vs Lithuanian In Labor Force | Age 20-64
COMPARE
Apache
Lithuanian
In Labor Force | Age 20-64
In Labor Force | Age 20-64 Comparison
Apache
Lithuanians
73.7%
IN LABOR FORCE | AGE 20-64
0.0/ 100
METRIC RATING
334th/ 347
METRIC RANK
80.2%
IN LABOR FORCE | AGE 20-64
98.7/ 100
METRIC RATING
65th/ 347
METRIC RANK
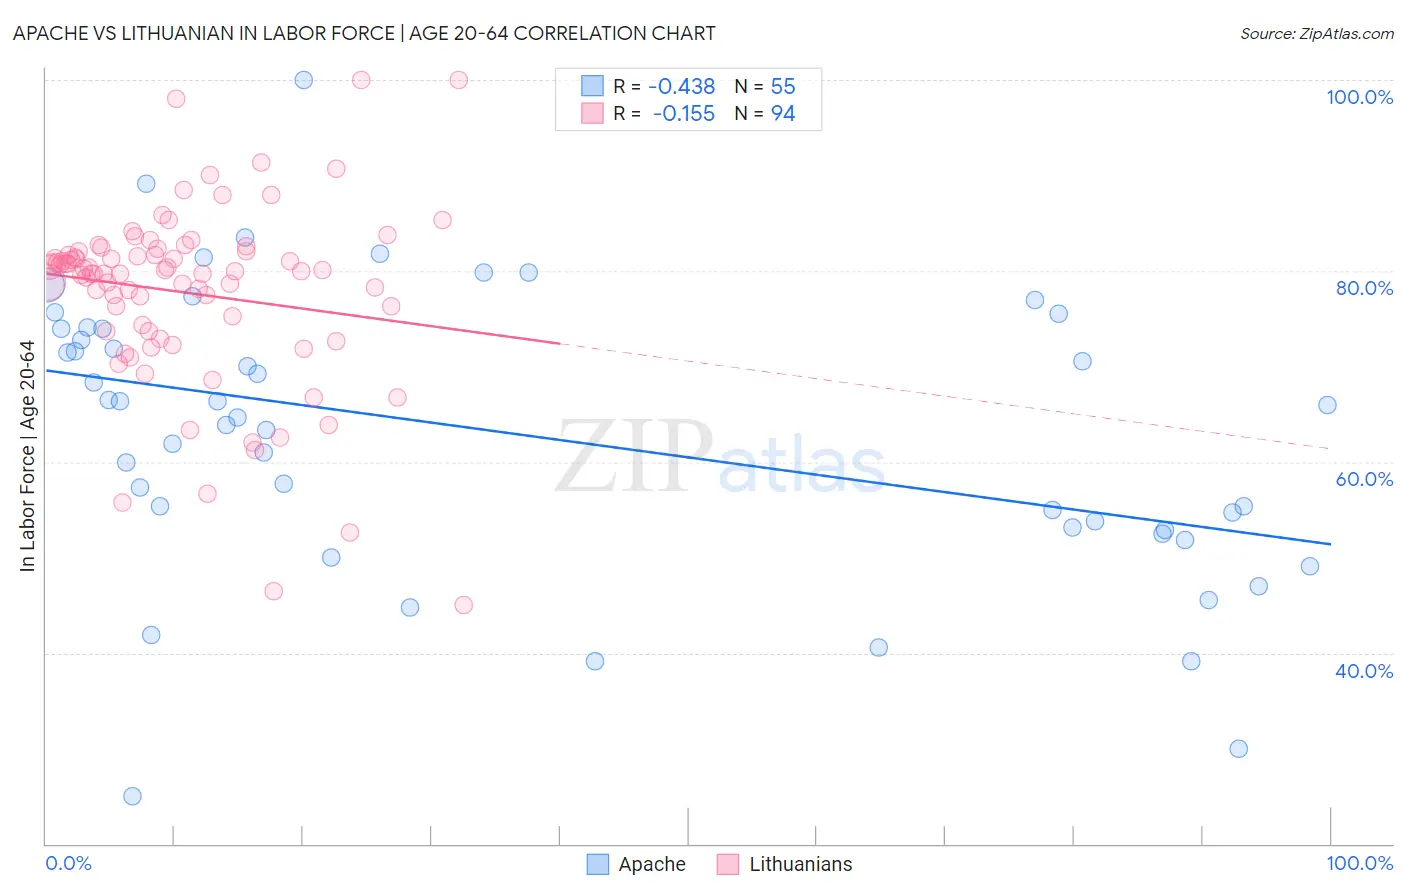
Apache vs Lithuanian In Labor Force | Age 20-64 Correlation Chart
The statistical analysis conducted on geographies consisting of 231,122,783 people shows a moderate negative correlation between the proportion of Apache and labor force participation rate among population between the ages 20 and 64 in the United States with a correlation coefficient (R) of -0.438 and weighted average of 73.7%. Similarly, the statistical analysis conducted on geographies consisting of 421,962,111 people shows a poor negative correlation between the proportion of Lithuanians and labor force participation rate among population between the ages 20 and 64 in the United States with a correlation coefficient (R) of -0.155 and weighted average of 80.2%, a difference of 8.9%.
In Labor Force | Age 20-64 Correlation Summary
| Measurement | Apache | Lithuanian |
| Minimum | 25.0% | 45.0% |
| Maximum | 100.0% | 100.0% |
| Range | 75.0% | 55.0% |
| Mean | 62.9% | 77.7% |
| Median | 64.7% | 80.0% |
| Interquartile 25% (IQ1) | 52.8% | 73.7% |
| Interquartile 75% (IQ3) | 74.0% | 82.0% |
| Interquartile Range (IQR) | 21.2% | 8.3% |
| Standard Deviation (Sample) | 15.1% | 9.6% |
| Standard Deviation (Population) | 15.0% | 9.5% |
Similar Demographics by In Labor Force | Age 20-64
Demographics Similar to Apache by In Labor Force | Age 20-64
In terms of in labor force | age 20-64, the demographic groups most similar to Apache are Ute (73.7%, a difference of 0.020%), Native/Alaskan (73.9%, a difference of 0.30%), Crow (73.3%, a difference of 0.52%), Yup'ik (73.2%, a difference of 0.64%), and Puerto Rican (73.1%, a difference of 0.85%).
| Demographics | Rating | Rank | In Labor Force | Age 20-64 |
| Sioux | 0.0 /100 | #327 | Tragic 75.0% |
| Kiowa | 0.0 /100 | #328 | Tragic 75.0% |
| Cheyenne | 0.0 /100 | #329 | Tragic 74.8% |
| Colville | 0.0 /100 | #330 | Tragic 74.8% |
| Paiute | 0.0 /100 | #331 | Tragic 74.7% |
| Arapaho | 0.0 /100 | #332 | Tragic 74.4% |
| Natives/Alaskans | 0.0 /100 | #333 | Tragic 73.9% |
| Apache | 0.0 /100 | #334 | Tragic 73.7% |
| Ute | 0.0 /100 | #335 | Tragic 73.7% |
| Crow | 0.0 /100 | #336 | Tragic 73.3% |
| Yup'ik | 0.0 /100 | #337 | Tragic 73.2% |
| Puerto Ricans | 0.0 /100 | #338 | Tragic 73.1% |
| Houma | 0.0 /100 | #339 | Tragic 72.7% |
| Pueblo | 0.0 /100 | #340 | Tragic 72.6% |
| Immigrants | Yemen | 0.0 /100 | #341 | Tragic 72.3% |
Demographics Similar to Lithuanians by In Labor Force | Age 20-64
In terms of in labor force | age 20-64, the demographic groups most similar to Lithuanians are Macedonian (80.2%, a difference of 0.0%), Immigrants from Korea (80.3%, a difference of 0.010%), Immigrants from Albania (80.3%, a difference of 0.010%), Taiwanese (80.2%, a difference of 0.010%), and Carpatho Rusyn (80.3%, a difference of 0.020%).
| Demographics | Rating | Rank | In Labor Force | Age 20-64 |
| Serbians | 98.9 /100 | #58 | Exceptional 80.3% |
| Swedes | 98.9 /100 | #59 | Exceptional 80.3% |
| Tongans | 98.8 /100 | #60 | Exceptional 80.3% |
| Burmese | 98.8 /100 | #61 | Exceptional 80.3% |
| Carpatho Rusyns | 98.8 /100 | #62 | Exceptional 80.3% |
| Immigrants | Korea | 98.8 /100 | #63 | Exceptional 80.3% |
| Immigrants | Albania | 98.7 /100 | #64 | Exceptional 80.3% |
| Lithuanians | 98.7 /100 | #65 | Exceptional 80.2% |
| Macedonians | 98.7 /100 | #66 | Exceptional 80.2% |
| Taiwanese | 98.6 /100 | #67 | Exceptional 80.2% |
| Bhutanese | 98.6 /100 | #68 | Exceptional 80.2% |
| Albanians | 98.6 /100 | #69 | Exceptional 80.2% |
| Immigrants | Turkey | 98.5 /100 | #70 | Exceptional 80.2% |
| Soviet Union | 98.5 /100 | #71 | Exceptional 80.2% |
| Eastern Europeans | 98.4 /100 | #72 | Exceptional 80.2% |