Immigrants from Singapore vs Immigrants from Latvia In Labor Force | Age 20-64
COMPARE
Immigrants from Singapore
Immigrants from Latvia
In Labor Force | Age 20-64
In Labor Force | Age 20-64 Comparison
Immigrants from Singapore
Immigrants from Latvia
79.9%
IN LABOR FORCE | AGE 20-64
86.7/ 100
METRIC RATING
136th/ 347
METRIC RANK
80.1%
IN LABOR FORCE | AGE 20-64
97.2/ 100
METRIC RATING
84th/ 347
METRIC RANK
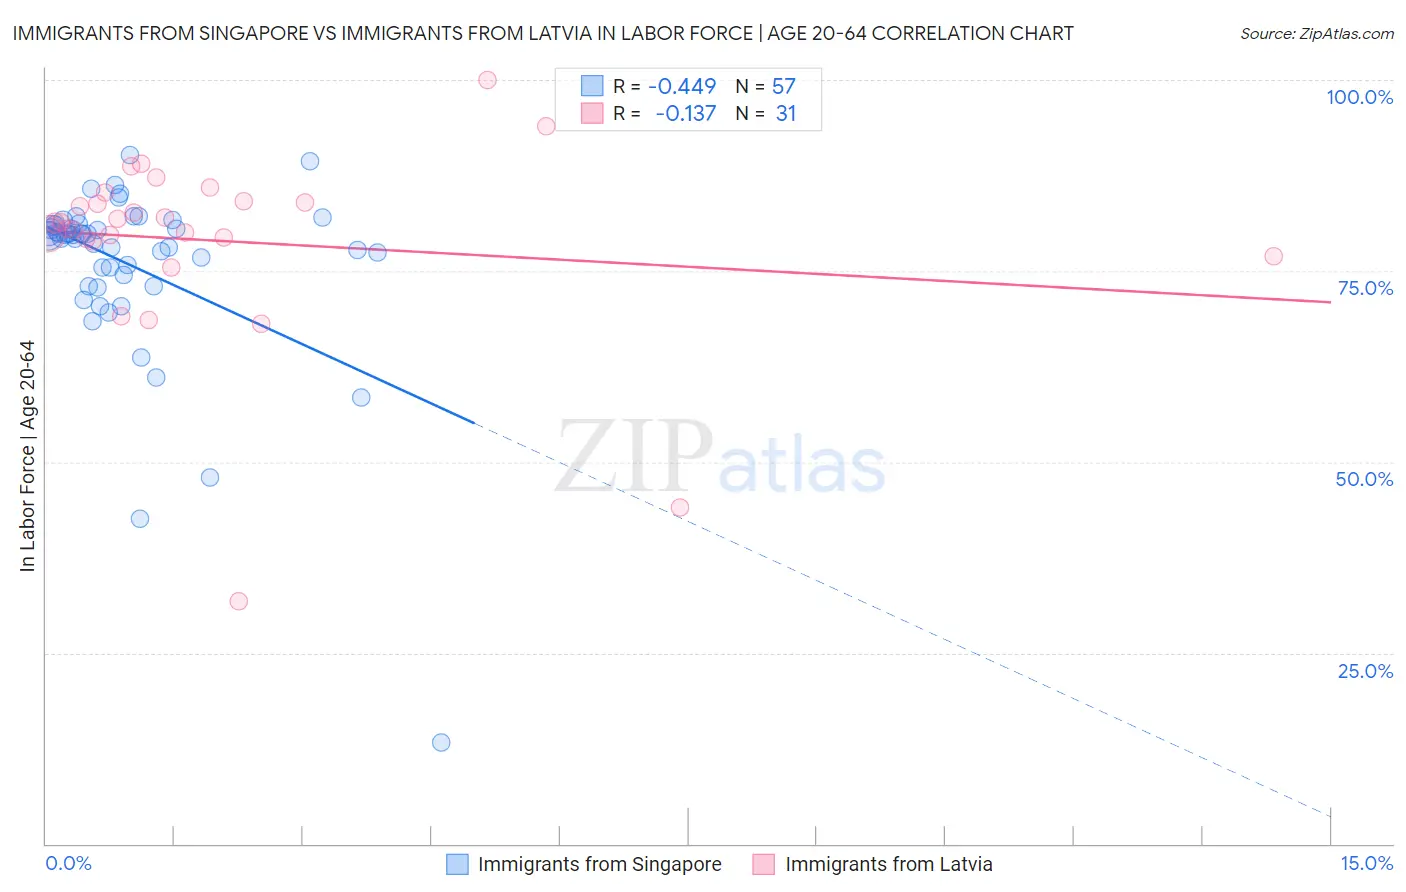
Immigrants from Singapore vs Immigrants from Latvia In Labor Force | Age 20-64 Correlation Chart
The statistical analysis conducted on geographies consisting of 137,521,700 people shows a moderate negative correlation between the proportion of Immigrants from Singapore and labor force participation rate among population between the ages 20 and 64 in the United States with a correlation coefficient (R) of -0.449 and weighted average of 79.9%. Similarly, the statistical analysis conducted on geographies consisting of 113,735,345 people shows a poor negative correlation between the proportion of Immigrants from Latvia and labor force participation rate among population between the ages 20 and 64 in the United States with a correlation coefficient (R) of -0.137 and weighted average of 80.1%, a difference of 0.34%.
In Labor Force | Age 20-64 Correlation Summary
| Measurement | Immigrants from Singapore | Immigrants from Latvia |
| Minimum | 13.2% | 31.8% |
| Maximum | 90.1% | 100.0% |
| Range | 76.9% | 68.2% |
| Mean | 75.7% | 78.9% |
| Median | 79.7% | 81.3% |
| Interquartile 25% (IQ1) | 73.7% | 78.9% |
| Interquartile 75% (IQ3) | 81.0% | 84.2% |
| Interquartile Range (IQR) | 7.3% | 5.3% |
| Standard Deviation (Sample) | 12.0% | 12.8% |
| Standard Deviation (Population) | 11.9% | 12.6% |
Similar Demographics by In Labor Force | Age 20-64
Demographics Similar to Immigrants from Singapore by In Labor Force | Age 20-64
In terms of in labor force | age 20-64, the demographic groups most similar to Immigrants from Singapore are Ukrainian (79.9%, a difference of 0.0%), Immigrants from Ukraine (79.9%, a difference of 0.0%), Belgian (79.9%, a difference of 0.010%), Immigrants from Nigeria (79.9%, a difference of 0.010%), and Indian (Asian) (79.9%, a difference of 0.020%).
| Demographics | Rating | Rank | In Labor Force | Age 20-64 |
| Italians | 88.9 /100 | #129 | Excellent 79.9% |
| Immigrants | Zaire | 88.6 /100 | #130 | Excellent 79.9% |
| Immigrants | Iran | 88.3 /100 | #131 | Excellent 79.9% |
| Indians (Asian) | 87.7 /100 | #132 | Excellent 79.9% |
| South American Indians | 87.6 /100 | #133 | Excellent 79.9% |
| Belgians | 87.4 /100 | #134 | Excellent 79.9% |
| Ukrainians | 86.8 /100 | #135 | Excellent 79.9% |
| Immigrants | Singapore | 86.7 /100 | #136 | Excellent 79.9% |
| Immigrants | Ukraine | 86.5 /100 | #137 | Excellent 79.9% |
| Immigrants | Nigeria | 86.4 /100 | #138 | Excellent 79.9% |
| Immigrants | Spain | 83.9 /100 | #139 | Excellent 79.8% |
| Immigrants | South Eastern Asia | 80.4 /100 | #140 | Excellent 79.8% |
| Immigrants | Israel | 80.0 /100 | #141 | Good 79.8% |
| Slovaks | 79.9 /100 | #142 | Good 79.8% |
| Immigrants | Sweden | 79.7 /100 | #143 | Good 79.8% |
Demographics Similar to Immigrants from Latvia by In Labor Force | Age 20-64
In terms of in labor force | age 20-64, the demographic groups most similar to Immigrants from Latvia are Colombian (80.1%, a difference of 0.0%), German Russian (80.1%, a difference of 0.010%), Immigrants from Japan (80.1%, a difference of 0.010%), Jordanian (80.1%, a difference of 0.010%), and Immigrants from Egypt (80.1%, a difference of 0.010%).
| Demographics | Rating | Rank | In Labor Force | Age 20-64 |
| Immigrants | Colombia | 97.8 /100 | #77 | Exceptional 80.2% |
| Immigrants | Romania | 97.8 /100 | #78 | Exceptional 80.2% |
| Asians | 97.7 /100 | #79 | Exceptional 80.2% |
| Immigrants | Croatia | 97.6 /100 | #80 | Exceptional 80.1% |
| German Russians | 97.3 /100 | #81 | Exceptional 80.1% |
| Immigrants | Japan | 97.3 /100 | #82 | Exceptional 80.1% |
| Colombians | 97.3 /100 | #83 | Exceptional 80.1% |
| Immigrants | Latvia | 97.2 /100 | #84 | Exceptional 80.1% |
| Jordanians | 97.2 /100 | #85 | Exceptional 80.1% |
| Immigrants | Egypt | 97.1 /100 | #86 | Exceptional 80.1% |
| Croatians | 97.1 /100 | #87 | Exceptional 80.1% |
| Chileans | 97.0 /100 | #88 | Exceptional 80.1% |
| Immigrants | Venezuela | 96.8 /100 | #89 | Exceptional 80.1% |
| Poles | 96.8 /100 | #90 | Exceptional 80.1% |
| Uruguayans | 96.7 /100 | #91 | Exceptional 80.1% |