Apache vs Immigrants from Latvia Professional Degree
COMPARE
Apache
Immigrants from Latvia
Professional Degree
Professional Degree Comparison
Apache
Immigrants from Latvia
3.5%
PROFESSIONAL DEGREE
0.5/ 100
METRIC RATING
281st/ 347
METRIC RANK
5.8%
PROFESSIONAL DEGREE
100.0/ 100
METRIC RATING
49th/ 347
METRIC RANK
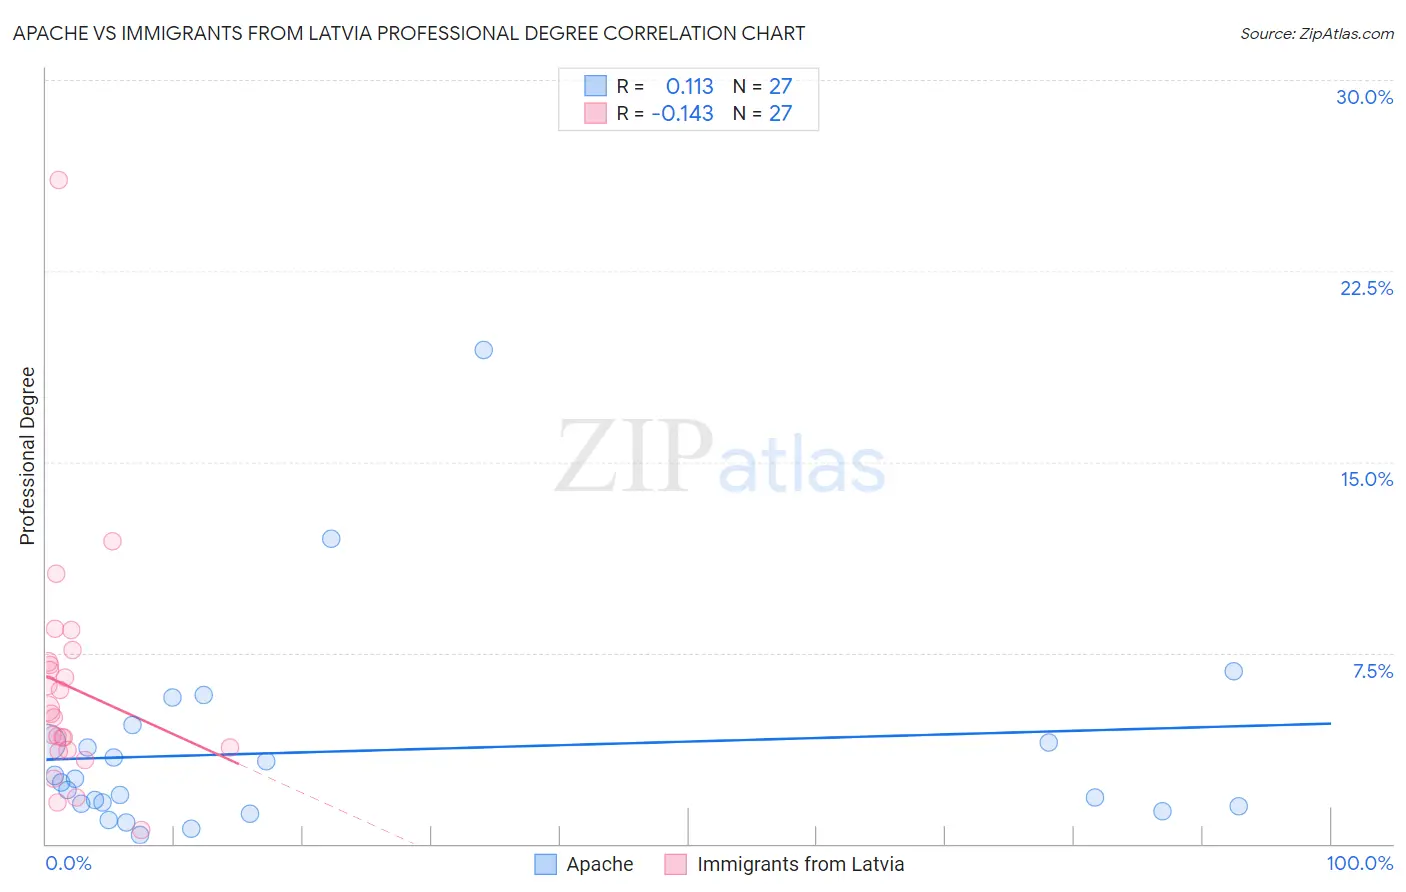
Apache vs Immigrants from Latvia Professional Degree Correlation Chart
The statistical analysis conducted on geographies consisting of 230,302,236 people shows a poor positive correlation between the proportion of Apache and percentage of population with at least professional degree education in the United States with a correlation coefficient (R) of 0.113 and weighted average of 3.5%. Similarly, the statistical analysis conducted on geographies consisting of 113,713,162 people shows a poor negative correlation between the proportion of Immigrants from Latvia and percentage of population with at least professional degree education in the United States with a correlation coefficient (R) of -0.143 and weighted average of 5.8%, a difference of 64.7%.
Professional Degree Correlation Summary
| Measurement | Apache | Immigrants from Latvia |
| Minimum | 0.33% | 0.54% |
| Maximum | 19.4% | 26.1% |
| Range | 19.1% | 25.5% |
| Mean | 3.6% | 6.1% |
| Median | 2.4% | 5.1% |
| Interquartile 25% (IQ1) | 1.5% | 3.7% |
| Interquartile 75% (IQ3) | 4.0% | 7.1% |
| Interquartile Range (IQR) | 2.5% | 3.4% |
| Standard Deviation (Sample) | 4.0% | 4.8% |
| Standard Deviation (Population) | 3.9% | 4.7% |
Similar Demographics by Professional Degree
Demographics Similar to Apache by Professional Degree
In terms of professional degree, the demographic groups most similar to Apache are Immigrants from Caribbean (3.5%, a difference of 0.020%), Dominican (3.5%, a difference of 0.030%), Immigrants from Portugal (3.5%, a difference of 0.060%), Japanese (3.5%, a difference of 0.10%), and Cheyenne (3.6%, a difference of 0.16%).
| Demographics | Rating | Rank | Professional Degree |
| Potawatomi | 0.5 /100 | #274 | Tragic 3.6% |
| Immigrants | Dominica | 0.5 /100 | #275 | Tragic 3.6% |
| Liberians | 0.5 /100 | #276 | Tragic 3.6% |
| Cheyenne | 0.5 /100 | #277 | Tragic 3.6% |
| Japanese | 0.5 /100 | #278 | Tragic 3.5% |
| Immigrants | Portugal | 0.5 /100 | #279 | Tragic 3.5% |
| Dominicans | 0.5 /100 | #280 | Tragic 3.5% |
| Apache | 0.5 /100 | #281 | Tragic 3.5% |
| Immigrants | Caribbean | 0.5 /100 | #282 | Tragic 3.5% |
| Comanche | 0.4 /100 | #283 | Tragic 3.5% |
| Salvadorans | 0.4 /100 | #284 | Tragic 3.5% |
| Hondurans | 0.3 /100 | #285 | Tragic 3.5% |
| Haitians | 0.3 /100 | #286 | Tragic 3.5% |
| Immigrants | El Salvador | 0.3 /100 | #287 | Tragic 3.5% |
| Blackfeet | 0.3 /100 | #288 | Tragic 3.5% |
Demographics Similar to Immigrants from Latvia by Professional Degree
In terms of professional degree, the demographic groups most similar to Immigrants from Latvia are Immigrants from Czechoslovakia (5.8%, a difference of 0.32%), Immigrants from Greece (5.8%, a difference of 0.38%), Paraguayan (5.9%, a difference of 0.40%), Immigrants from Serbia (5.8%, a difference of 0.45%), and Immigrants from Netherlands (5.8%, a difference of 0.68%).
| Demographics | Rating | Rank | Professional Degree |
| Estonians | 100.0 /100 | #42 | Exceptional 6.0% |
| Immigrants | Saudi Arabia | 100.0 /100 | #43 | Exceptional 5.9% |
| Argentineans | 100.0 /100 | #44 | Exceptional 5.9% |
| Immigrants | South Central Asia | 100.0 /100 | #45 | Exceptional 5.9% |
| Immigrants | Argentina | 100.0 /100 | #46 | Exceptional 5.9% |
| Australians | 100.0 /100 | #47 | Exceptional 5.9% |
| Paraguayans | 100.0 /100 | #48 | Exceptional 5.9% |
| Immigrants | Latvia | 100.0 /100 | #49 | Exceptional 5.8% |
| Immigrants | Czechoslovakia | 100.0 /100 | #50 | Exceptional 5.8% |
| Immigrants | Greece | 100.0 /100 | #51 | Exceptional 5.8% |
| Immigrants | Serbia | 100.0 /100 | #52 | Exceptional 5.8% |
| Immigrants | Netherlands | 100.0 /100 | #53 | Exceptional 5.8% |
| Immigrants | Kuwait | 100.0 /100 | #54 | Exceptional 5.7% |
| Immigrants | Western Europe | 100.0 /100 | #55 | Exceptional 5.7% |
| Immigrants | Malaysia | 100.0 /100 | #56 | Exceptional 5.7% |