Nonimmigrants vs Immigrants from Latvia In Labor Force | Age 20-64
COMPARE
Nonimmigrants
Immigrants from Latvia
In Labor Force | Age 20-64
In Labor Force | Age 20-64 Comparison
Nonimmigrants
Immigrants from Latvia
78.1%
IN LABOR FORCE | AGE 20-64
0.0/ 100
METRIC RATING
283rd/ 347
METRIC RANK
80.1%
IN LABOR FORCE | AGE 20-64
97.2/ 100
METRIC RATING
84th/ 347
METRIC RANK
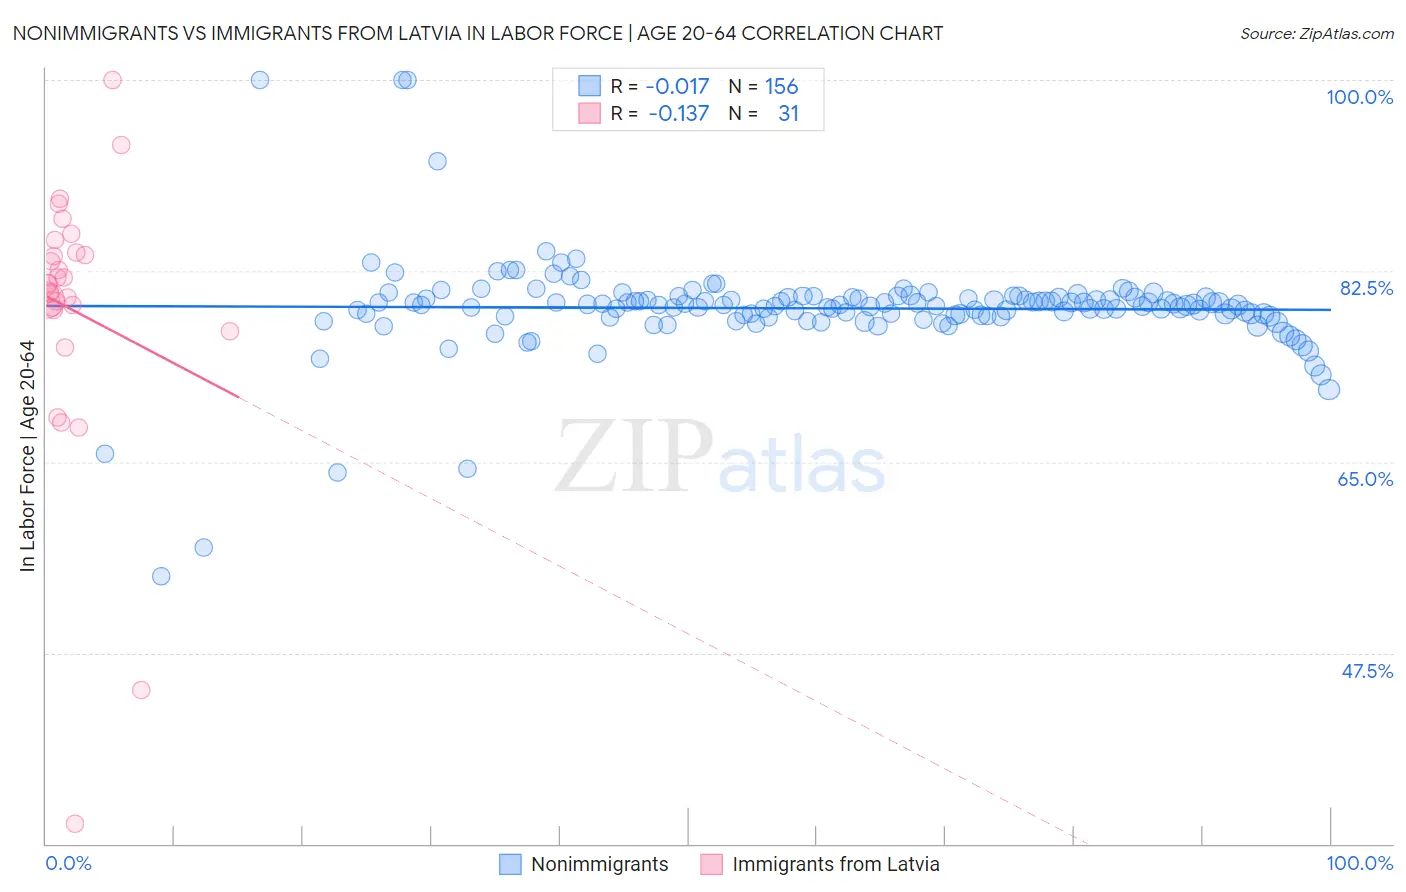
Nonimmigrants vs Immigrants from Latvia In Labor Force | Age 20-64 Correlation Chart
The statistical analysis conducted on geographies consisting of 585,321,866 people shows no correlation between the proportion of Nonimmigrants and labor force participation rate among population between the ages 20 and 64 in the United States with a correlation coefficient (R) of -0.017 and weighted average of 78.1%. Similarly, the statistical analysis conducted on geographies consisting of 113,735,345 people shows a poor negative correlation between the proportion of Immigrants from Latvia and labor force participation rate among population between the ages 20 and 64 in the United States with a correlation coefficient (R) of -0.137 and weighted average of 80.1%, a difference of 2.6%.
In Labor Force | Age 20-64 Correlation Summary
| Measurement | Nonimmigrants | Immigrants from Latvia |
| Minimum | 54.5% | 31.8% |
| Maximum | 100.0% | 100.0% |
| Range | 45.5% | 68.2% |
| Mean | 79.1% | 78.9% |
| Median | 79.4% | 81.3% |
| Interquartile 25% (IQ1) | 78.4% | 78.9% |
| Interquartile 75% (IQ3) | 80.0% | 84.2% |
| Interquartile Range (IQR) | 1.7% | 5.3% |
| Standard Deviation (Sample) | 4.9% | 12.8% |
| Standard Deviation (Population) | 4.9% | 12.6% |
Similar Demographics by In Labor Force | Age 20-64
Demographics Similar to Nonimmigrants by In Labor Force | Age 20-64
In terms of in labor force | age 20-64, the demographic groups most similar to Nonimmigrants are Immigrants from St. Vincent and the Grenadines (78.1%, a difference of 0.010%), Immigrants from Guyana (78.1%, a difference of 0.010%), Guyanese (78.1%, a difference of 0.030%), Immigrants from Dominica (78.1%, a difference of 0.060%), and Belizean (78.2%, a difference of 0.11%).
| Demographics | Rating | Rank | In Labor Force | Age 20-64 |
| Puget Sound Salish | 0.0 /100 | #276 | Tragic 78.2% |
| Immigrants | Bahamas | 0.0 /100 | #277 | Tragic 78.2% |
| Mexican American Indians | 0.0 /100 | #278 | Tragic 78.2% |
| Belizeans | 0.0 /100 | #279 | Tragic 78.2% |
| Immigrants | Dominica | 0.0 /100 | #280 | Tragic 78.1% |
| Guyanese | 0.0 /100 | #281 | Tragic 78.1% |
| Immigrants | St. Vincent and the Grenadines | 0.0 /100 | #282 | Tragic 78.1% |
| Immigrants | Nonimmigrants | 0.0 /100 | #283 | Tragic 78.1% |
| Immigrants | Guyana | 0.0 /100 | #284 | Tragic 78.1% |
| Osage | 0.0 /100 | #285 | Tragic 78.0% |
| Immigrants | Belize | 0.0 /100 | #286 | Tragic 78.0% |
| Vietnamese | 0.0 /100 | #287 | Tragic 78.0% |
| Hmong | 0.0 /100 | #288 | Tragic 77.9% |
| Africans | 0.0 /100 | #289 | Tragic 77.9% |
| Immigrants | Bangladesh | 0.0 /100 | #290 | Tragic 77.9% |
Demographics Similar to Immigrants from Latvia by In Labor Force | Age 20-64
In terms of in labor force | age 20-64, the demographic groups most similar to Immigrants from Latvia are Colombian (80.1%, a difference of 0.0%), German Russian (80.1%, a difference of 0.010%), Immigrants from Japan (80.1%, a difference of 0.010%), Jordanian (80.1%, a difference of 0.010%), and Immigrants from Egypt (80.1%, a difference of 0.010%).
| Demographics | Rating | Rank | In Labor Force | Age 20-64 |
| Immigrants | Colombia | 97.8 /100 | #77 | Exceptional 80.2% |
| Immigrants | Romania | 97.8 /100 | #78 | Exceptional 80.2% |
| Asians | 97.7 /100 | #79 | Exceptional 80.2% |
| Immigrants | Croatia | 97.6 /100 | #80 | Exceptional 80.1% |
| German Russians | 97.3 /100 | #81 | Exceptional 80.1% |
| Immigrants | Japan | 97.3 /100 | #82 | Exceptional 80.1% |
| Colombians | 97.3 /100 | #83 | Exceptional 80.1% |
| Immigrants | Latvia | 97.2 /100 | #84 | Exceptional 80.1% |
| Jordanians | 97.2 /100 | #85 | Exceptional 80.1% |
| Immigrants | Egypt | 97.1 /100 | #86 | Exceptional 80.1% |
| Croatians | 97.1 /100 | #87 | Exceptional 80.1% |
| Chileans | 97.0 /100 | #88 | Exceptional 80.1% |
| Immigrants | Venezuela | 96.8 /100 | #89 | Exceptional 80.1% |
| Poles | 96.8 /100 | #90 | Exceptional 80.1% |
| Uruguayans | 96.7 /100 | #91 | Exceptional 80.1% |