Apache vs Brazilian 9th Grade
COMPARE
Apache
Brazilian
9th Grade
9th Grade Comparison
Apache
Brazilians
94.3%
9TH GRADE
4.2/ 100
METRIC RATING
230th/ 347
METRIC RANK
94.9%
9TH GRADE
49.8/ 100
METRIC RATING
175th/ 347
METRIC RANK
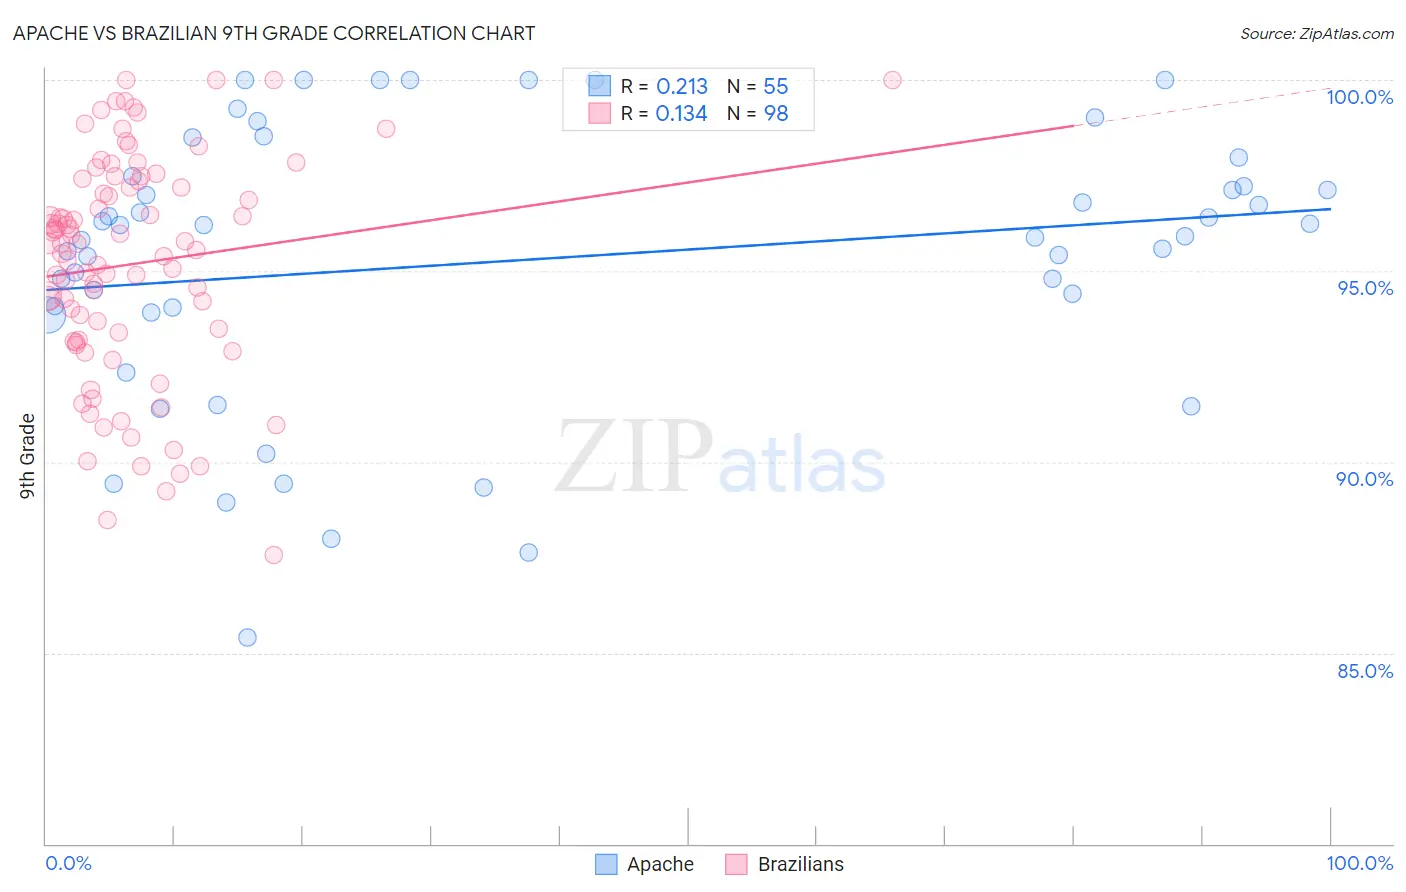
Apache vs Brazilian 9th Grade Correlation Chart
The statistical analysis conducted on geographies consisting of 231,142,637 people shows a weak positive correlation between the proportion of Apache and percentage of population with at least 9th grade education in the United States with a correlation coefficient (R) of 0.213 and weighted average of 94.3%. Similarly, the statistical analysis conducted on geographies consisting of 323,900,771 people shows a poor positive correlation between the proportion of Brazilians and percentage of population with at least 9th grade education in the United States with a correlation coefficient (R) of 0.134 and weighted average of 94.9%, a difference of 0.58%.
9th Grade Correlation Summary
| Measurement | Apache | Brazilian |
| Minimum | 85.4% | 87.6% |
| Maximum | 100.0% | 100.0% |
| Range | 14.6% | 12.4% |
| Mean | 95.3% | 95.2% |
| Median | 95.9% | 95.7% |
| Interquartile 25% (IQ1) | 93.9% | 93.2% |
| Interquartile 75% (IQ3) | 97.5% | 97.3% |
| Interquartile Range (IQR) | 3.6% | 4.1% |
| Standard Deviation (Sample) | 3.6% | 2.9% |
| Standard Deviation (Population) | 3.6% | 2.9% |
Similar Demographics by 9th Grade
Demographics Similar to Apache by 9th Grade
In terms of 9th grade, the demographic groups most similar to Apache are Immigrants from Panama (94.3%, a difference of 0.010%), Immigrants from Africa (94.3%, a difference of 0.010%), Lumbee (94.4%, a difference of 0.020%), Immigrants from Southern Europe (94.3%, a difference of 0.020%), and Nigerian (94.3%, a difference of 0.020%).
| Demographics | Rating | Rank | 9th Grade |
| Bahamians | 7.0 /100 | #223 | Tragic 94.4% |
| Tongans | 6.0 /100 | #224 | Tragic 94.4% |
| Ethiopians | 5.4 /100 | #225 | Tragic 94.4% |
| Sub-Saharan Africans | 5.4 /100 | #226 | Tragic 94.4% |
| Immigrants | Sierra Leone | 4.8 /100 | #227 | Tragic 94.4% |
| Lumbee | 4.7 /100 | #228 | Tragic 94.4% |
| Immigrants | Southern Europe | 4.5 /100 | #229 | Tragic 94.3% |
| Apache | 4.2 /100 | #230 | Tragic 94.3% |
| Immigrants | Panama | 4.0 /100 | #231 | Tragic 94.3% |
| Immigrants | Africa | 3.9 /100 | #232 | Tragic 94.3% |
| Nigerians | 3.7 /100 | #233 | Tragic 94.3% |
| Costa Ricans | 3.5 /100 | #234 | Tragic 94.3% |
| Bolivians | 3.3 /100 | #235 | Tragic 94.3% |
| Somalis | 2.9 /100 | #236 | Tragic 94.3% |
| Koreans | 2.9 /100 | #237 | Tragic 94.3% |
Demographics Similar to Brazilians by 9th Grade
In terms of 9th grade, the demographic groups most similar to Brazilians are Immigrants from Egypt (94.9%, a difference of 0.0%), Cheyenne (94.9%, a difference of 0.010%), Immigrants from Spain (94.9%, a difference of 0.010%), Immigrants from Iraq (94.9%, a difference of 0.010%), and Immigrants from Poland (94.9%, a difference of 0.020%).
| Demographics | Rating | Rank | 9th Grade |
| Chileans | 60.7 /100 | #168 | Good 95.0% |
| Spaniards | 59.6 /100 | #169 | Average 94.9% |
| Alsatians | 58.6 /100 | #170 | Average 94.9% |
| Colville | 58.5 /100 | #171 | Average 94.9% |
| Iraqis | 54.0 /100 | #172 | Average 94.9% |
| Cheyenne | 51.5 /100 | #173 | Average 94.9% |
| Immigrants | Egypt | 50.0 /100 | #174 | Average 94.9% |
| Brazilians | 49.8 /100 | #175 | Average 94.9% |
| Immigrants | Spain | 49.1 /100 | #176 | Average 94.9% |
| Immigrants | Iraq | 47.8 /100 | #177 | Average 94.9% |
| Immigrants | Poland | 46.7 /100 | #178 | Average 94.9% |
| Immigrants | Venezuela | 46.5 /100 | #179 | Average 94.9% |
| Immigrants | Uganda | 43.1 /100 | #180 | Average 94.8% |
| Sierra Leoneans | 42.7 /100 | #181 | Average 94.8% |
| Seminole | 42.5 /100 | #182 | Average 94.8% |