Apache vs Brazilian College, 1 year or more
COMPARE
Apache
Brazilian
College, 1 year or more
College, 1 year or more Comparison
Apache
Brazilians
51.8%
COLLEGE, 1 YEAR OR MORE
0.0/ 100
METRIC RATING
309th/ 347
METRIC RANK
60.5%
COLLEGE, 1 YEAR OR MORE
79.0/ 100
METRIC RATING
149th/ 347
METRIC RANK
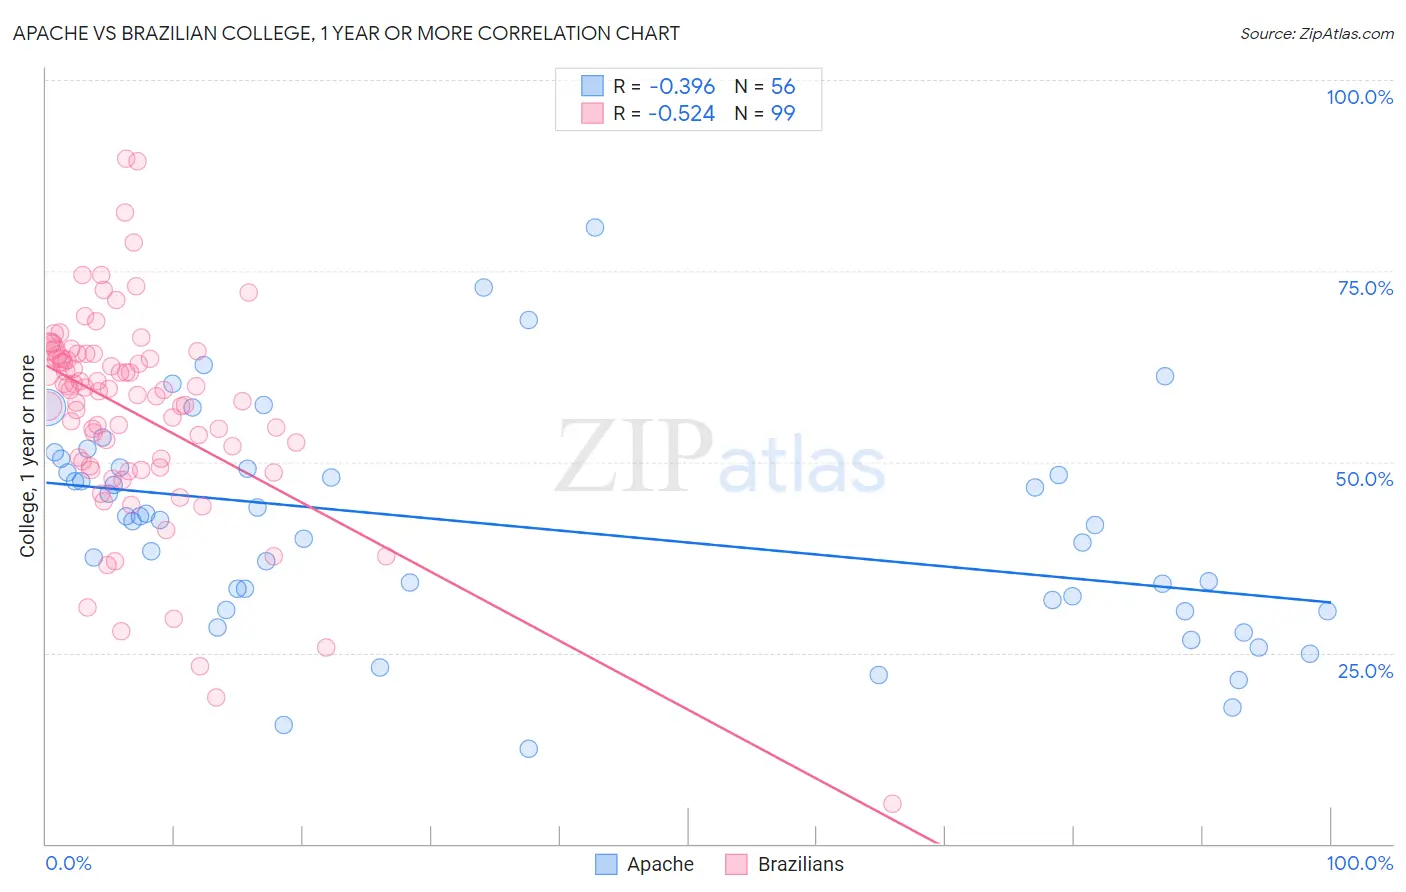
Apache vs Brazilian College, 1 year or more Correlation Chart
The statistical analysis conducted on geographies consisting of 231,142,948 people shows a mild negative correlation between the proportion of Apache and percentage of population with at least college, 1 year or more education in the United States with a correlation coefficient (R) of -0.396 and weighted average of 51.8%. Similarly, the statistical analysis conducted on geographies consisting of 323,962,626 people shows a substantial negative correlation between the proportion of Brazilians and percentage of population with at least college, 1 year or more education in the United States with a correlation coefficient (R) of -0.524 and weighted average of 60.5%, a difference of 16.7%.
College, 1 year or more Correlation Summary
| Measurement | Apache | Brazilian |
| Minimum | 12.5% | 5.3% |
| Maximum | 80.6% | 89.6% |
| Range | 68.1% | 84.3% |
| Mean | 41.5% | 56.5% |
| Median | 42.4% | 59.4% |
| Interquartile 25% (IQ1) | 31.2% | 49.4% |
| Interquartile 75% (IQ3) | 49.2% | 64.1% |
| Interquartile Range (IQR) | 18.0% | 14.7% |
| Standard Deviation (Sample) | 14.3% | 13.7% |
| Standard Deviation (Population) | 14.1% | 13.6% |
Similar Demographics by College, 1 year or more
Demographics Similar to Apache by College, 1 year or more
In terms of college, 1 year or more, the demographic groups most similar to Apache are Salvadoran (51.8%, a difference of 0.010%), Immigrants from Portugal (51.9%, a difference of 0.11%), Mexican American Indian (51.9%, a difference of 0.22%), Honduran (51.6%, a difference of 0.39%), and Seminole (52.1%, a difference of 0.55%).
| Demographics | Rating | Rank | College, 1 year or more |
| Puerto Ricans | 0.0 /100 | #302 | Tragic 52.2% |
| Creek | 0.0 /100 | #303 | Tragic 52.2% |
| Central Americans | 0.0 /100 | #304 | Tragic 52.1% |
| Seminole | 0.0 /100 | #305 | Tragic 52.1% |
| Mexican American Indians | 0.0 /100 | #306 | Tragic 51.9% |
| Immigrants | Portugal | 0.0 /100 | #307 | Tragic 51.9% |
| Salvadorans | 0.0 /100 | #308 | Tragic 51.8% |
| Apache | 0.0 /100 | #309 | Tragic 51.8% |
| Hondurans | 0.0 /100 | #310 | Tragic 51.6% |
| Immigrants | Haiti | 0.0 /100 | #311 | Tragic 51.5% |
| Pueblo | 0.0 /100 | #312 | Tragic 51.5% |
| Immigrants | Caribbean | 0.0 /100 | #313 | Tragic 51.4% |
| Fijians | 0.0 /100 | #314 | Tragic 51.3% |
| Guatemalans | 0.0 /100 | #315 | Tragic 51.2% |
| Cajuns | 0.0 /100 | #316 | Tragic 51.2% |
Demographics Similar to Brazilians by College, 1 year or more
In terms of college, 1 year or more, the demographic groups most similar to Brazilians are Kenyan (60.5%, a difference of 0.0%), Immigrants from Kenya (60.5%, a difference of 0.010%), Immigrants from Sudan (60.4%, a difference of 0.090%), Albanian (60.4%, a difference of 0.090%), and Scottish (60.5%, a difference of 0.10%).
| Demographics | Rating | Rank | College, 1 year or more |
| Poles | 82.8 /100 | #142 | Excellent 60.7% |
| Canadians | 82.7 /100 | #143 | Excellent 60.6% |
| Czechs | 81.9 /100 | #144 | Excellent 60.6% |
| Slavs | 81.1 /100 | #145 | Excellent 60.6% |
| Scottish | 80.2 /100 | #146 | Excellent 60.5% |
| Immigrants | Kenya | 79.1 /100 | #147 | Good 60.5% |
| Kenyans | 79.0 /100 | #148 | Good 60.5% |
| Brazilians | 79.0 /100 | #149 | Good 60.5% |
| Immigrants | Sudan | 77.8 /100 | #150 | Good 60.4% |
| Albanians | 77.8 /100 | #151 | Good 60.4% |
| Immigrants | Germany | 76.1 /100 | #152 | Good 60.3% |
| Sierra Leoneans | 74.1 /100 | #153 | Good 60.2% |
| Sudanese | 73.0 /100 | #154 | Good 60.2% |
| Moroccans | 72.9 /100 | #155 | Good 60.2% |
| Finns | 72.9 /100 | #156 | Good 60.2% |