Alsatian vs Chilean In Labor Force | Age 20-64
COMPARE
Alsatian
Chilean
In Labor Force | Age 20-64
In Labor Force | Age 20-64 Comparison
Alsatians
Chileans
79.1%
IN LABOR FORCE | AGE 20-64
5.7/ 100
METRIC RATING
229th/ 347
METRIC RANK
80.1%
IN LABOR FORCE | AGE 20-64
97.0/ 100
METRIC RATING
88th/ 347
METRIC RANK
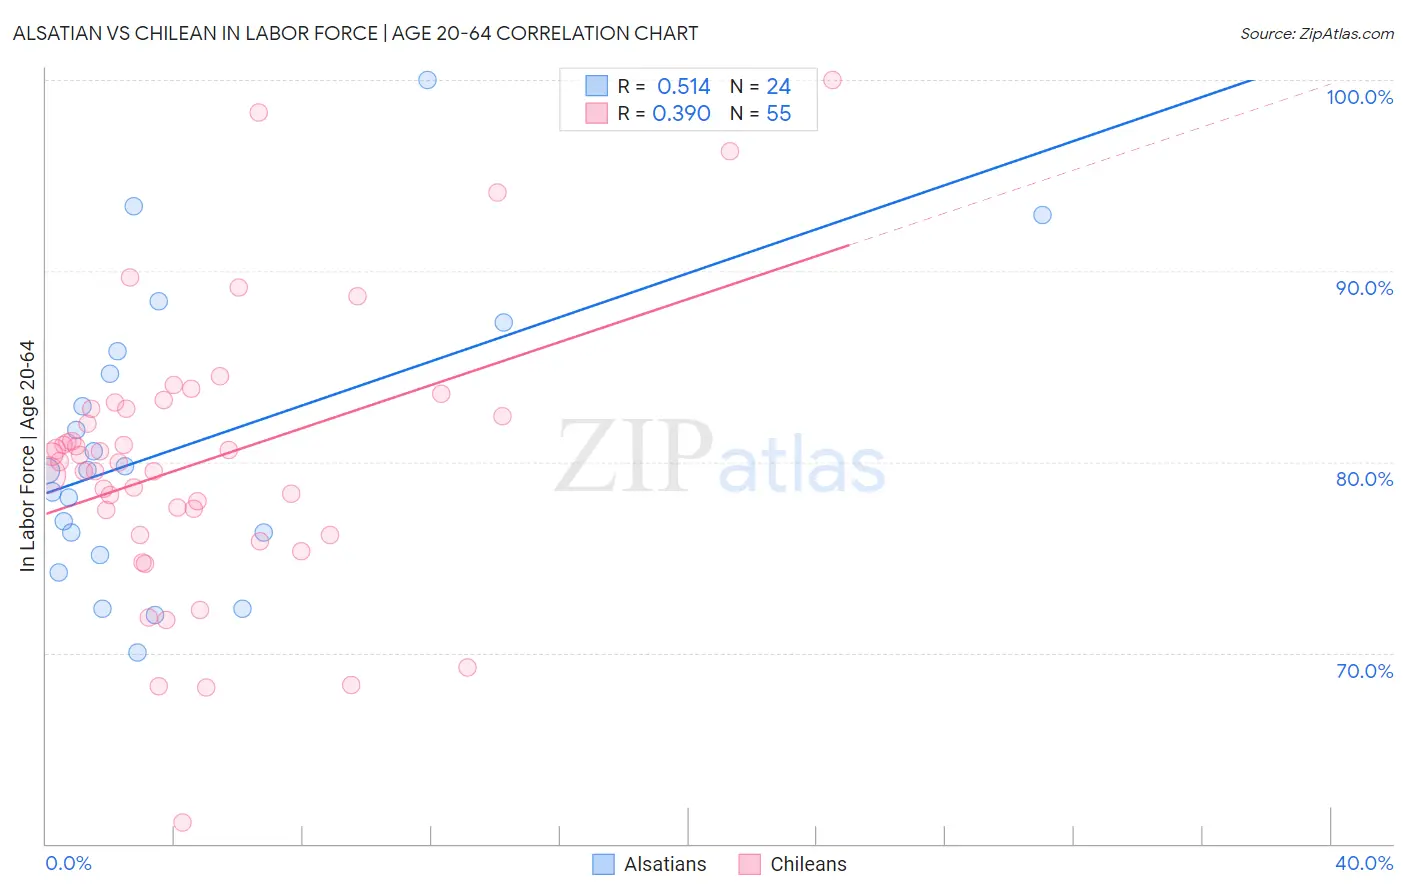
Alsatian vs Chilean In Labor Force | Age 20-64 Correlation Chart
The statistical analysis conducted on geographies consisting of 82,681,658 people shows a substantial positive correlation between the proportion of Alsatians and labor force participation rate among population between the ages 20 and 64 in the United States with a correlation coefficient (R) of 0.514 and weighted average of 79.1%. Similarly, the statistical analysis conducted on geographies consisting of 256,687,224 people shows a mild positive correlation between the proportion of Chileans and labor force participation rate among population between the ages 20 and 64 in the United States with a correlation coefficient (R) of 0.390 and weighted average of 80.1%, a difference of 1.3%.
In Labor Force | Age 20-64 Correlation Summary
| Measurement | Alsatian | Chilean |
| Minimum | 70.0% | 61.1% |
| Maximum | 100.0% | 100.0% |
| Range | 30.0% | 38.9% |
| Mean | 80.8% | 80.0% |
| Median | 79.6% | 80.0% |
| Interquartile 25% (IQ1) | 75.7% | 76.2% |
| Interquartile 75% (IQ3) | 85.2% | 82.8% |
| Interquartile Range (IQR) | 9.5% | 6.6% |
| Standard Deviation (Sample) | 7.5% | 7.2% |
| Standard Deviation (Population) | 7.4% | 7.1% |
Similar Demographics by In Labor Force | Age 20-64
Demographics Similar to Alsatians by In Labor Force | Age 20-64
In terms of in labor force | age 20-64, the demographic groups most similar to Alsatians are Panamanian (79.1%, a difference of 0.0%), Native Hawaiian (79.1%, a difference of 0.0%), Central American (79.1%, a difference of 0.010%), Immigrants from Western Europe (79.1%, a difference of 0.010%), and Portuguese (79.1%, a difference of 0.020%).
| Demographics | Rating | Rank | In Labor Force | Age 20-64 |
| Immigrants | Panama | 6.9 /100 | #222 | Tragic 79.1% |
| Canadians | 6.8 /100 | #223 | Tragic 79.1% |
| Immigrants | Uzbekistan | 6.8 /100 | #224 | Tragic 79.1% |
| Portuguese | 6.4 /100 | #225 | Tragic 79.1% |
| Central Americans | 5.9 /100 | #226 | Tragic 79.1% |
| Immigrants | Western Europe | 5.9 /100 | #227 | Tragic 79.1% |
| Panamanians | 5.7 /100 | #228 | Tragic 79.1% |
| Alsatians | 5.7 /100 | #229 | Tragic 79.1% |
| Native Hawaiians | 5.6 /100 | #230 | Tragic 79.1% |
| Lebanese | 5.1 /100 | #231 | Tragic 79.1% |
| Guamanians/Chamorros | 4.5 /100 | #232 | Tragic 79.1% |
| Japanese | 4.0 /100 | #233 | Tragic 79.1% |
| Immigrants | Canada | 3.2 /100 | #234 | Tragic 79.0% |
| Tlingit-Haida | 3.2 /100 | #235 | Tragic 79.0% |
| Samoans | 2.9 /100 | #236 | Tragic 79.0% |
Demographics Similar to Chileans by In Labor Force | Age 20-64
In terms of in labor force | age 20-64, the demographic groups most similar to Chileans are Jordanian (80.1%, a difference of 0.010%), Immigrants from Egypt (80.1%, a difference of 0.010%), Croatian (80.1%, a difference of 0.010%), Immigrants from Venezuela (80.1%, a difference of 0.010%), and Polish (80.1%, a difference of 0.010%).
| Demographics | Rating | Rank | In Labor Force | Age 20-64 |
| German Russians | 97.3 /100 | #81 | Exceptional 80.1% |
| Immigrants | Japan | 97.3 /100 | #82 | Exceptional 80.1% |
| Colombians | 97.3 /100 | #83 | Exceptional 80.1% |
| Immigrants | Latvia | 97.2 /100 | #84 | Exceptional 80.1% |
| Jordanians | 97.2 /100 | #85 | Exceptional 80.1% |
| Immigrants | Egypt | 97.1 /100 | #86 | Exceptional 80.1% |
| Croatians | 97.1 /100 | #87 | Exceptional 80.1% |
| Chileans | 97.0 /100 | #88 | Exceptional 80.1% |
| Immigrants | Venezuela | 96.8 /100 | #89 | Exceptional 80.1% |
| Poles | 96.8 /100 | #90 | Exceptional 80.1% |
| Uruguayans | 96.7 /100 | #91 | Exceptional 80.1% |
| Ghanaians | 96.7 /100 | #92 | Exceptional 80.1% |
| Immigrants | Belarus | 96.4 /100 | #93 | Exceptional 80.1% |
| Immigrants | Asia | 96.0 /100 | #94 | Exceptional 80.1% |
| Yugoslavians | 95.9 /100 | #95 | Exceptional 80.1% |