Aleut vs Samoan In Labor Force | Age 20-64
COMPARE
Aleut
Samoan
In Labor Force | Age 20-64
In Labor Force | Age 20-64 Comparison
Aleuts
Samoans
78.2%
IN LABOR FORCE | AGE 20-64
0.0/ 100
METRIC RATING
274th/ 347
METRIC RANK
79.0%
IN LABOR FORCE | AGE 20-64
2.9/ 100
METRIC RATING
236th/ 347
METRIC RANK
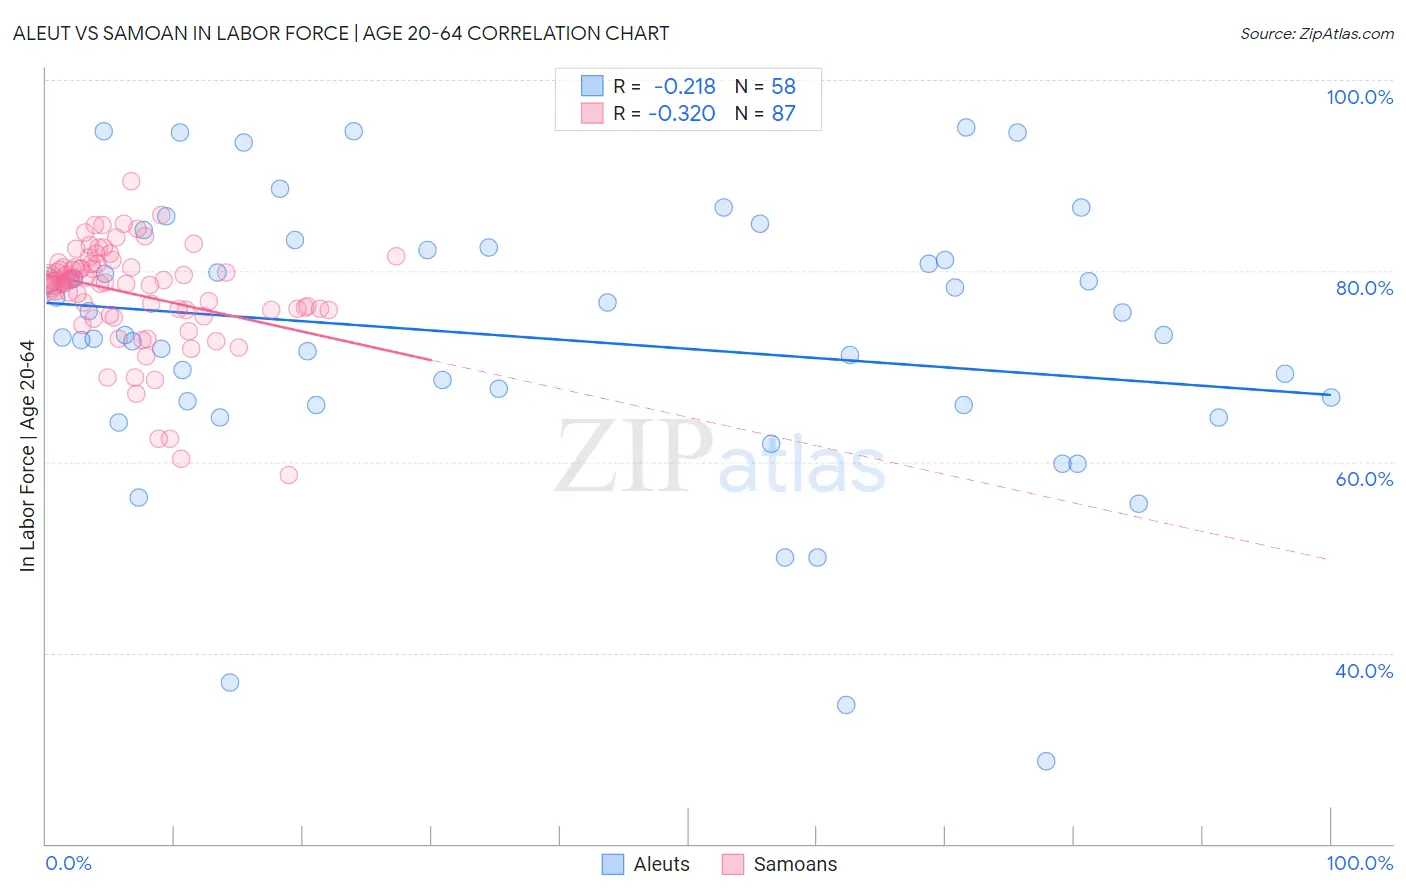
Aleut vs Samoan In Labor Force | Age 20-64 Correlation Chart
The statistical analysis conducted on geographies consisting of 61,782,784 people shows a weak negative correlation between the proportion of Aleuts and labor force participation rate among population between the ages 20 and 64 in the United States with a correlation coefficient (R) of -0.218 and weighted average of 78.2%. Similarly, the statistical analysis conducted on geographies consisting of 225,189,054 people shows a mild negative correlation between the proportion of Samoans and labor force participation rate among population between the ages 20 and 64 in the United States with a correlation coefficient (R) of -0.320 and weighted average of 79.0%, a difference of 1.0%.
In Labor Force | Age 20-64 Correlation Summary
| Measurement | Aleut | Samoan |
| Minimum | 28.6% | 58.6% |
| Maximum | 95.0% | 89.4% |
| Range | 66.4% | 30.8% |
| Mean | 73.0% | 77.6% |
| Median | 73.3% | 78.8% |
| Interquartile 25% (IQ1) | 66.0% | 75.9% |
| Interquartile 75% (IQ3) | 82.2% | 80.7% |
| Interquartile Range (IQR) | 16.2% | 4.9% |
| Standard Deviation (Sample) | 14.4% | 5.5% |
| Standard Deviation (Population) | 14.3% | 5.5% |
Similar Demographics by In Labor Force | Age 20-64
Demographics Similar to Aleuts by In Labor Force | Age 20-64
In terms of in labor force | age 20-64, the demographic groups most similar to Aleuts are Spanish (78.2%, a difference of 0.010%), Puget Sound Salish (78.2%, a difference of 0.010%), French American Indian (78.2%, a difference of 0.020%), Immigrants from Bahamas (78.2%, a difference of 0.020%), and Mexican American Indian (78.2%, a difference of 0.030%).
| Demographics | Rating | Rank | In Labor Force | Age 20-64 |
| U.S. Virgin Islanders | 0.1 /100 | #267 | Tragic 78.4% |
| West Indians | 0.0 /100 | #268 | Tragic 78.3% |
| Immigrants | Barbados | 0.0 /100 | #269 | Tragic 78.3% |
| Scotch-Irish | 0.0 /100 | #270 | Tragic 78.3% |
| Immigrants | Latin America | 0.0 /100 | #271 | Tragic 78.3% |
| Marshallese | 0.0 /100 | #272 | Tragic 78.3% |
| French American Indians | 0.0 /100 | #273 | Tragic 78.2% |
| Aleuts | 0.0 /100 | #274 | Tragic 78.2% |
| Spanish | 0.0 /100 | #275 | Tragic 78.2% |
| Puget Sound Salish | 0.0 /100 | #276 | Tragic 78.2% |
| Immigrants | Bahamas | 0.0 /100 | #277 | Tragic 78.2% |
| Mexican American Indians | 0.0 /100 | #278 | Tragic 78.2% |
| Belizeans | 0.0 /100 | #279 | Tragic 78.2% |
| Immigrants | Dominica | 0.0 /100 | #280 | Tragic 78.1% |
| Guyanese | 0.0 /100 | #281 | Tragic 78.1% |
Demographics Similar to Samoans by In Labor Force | Age 20-64
In terms of in labor force | age 20-64, the demographic groups most similar to Samoans are Immigrants from North America (79.0%, a difference of 0.0%), Immigrants from Canada (79.0%, a difference of 0.020%), Tlingit-Haida (79.0%, a difference of 0.020%), Immigrants from Jamaica (79.0%, a difference of 0.030%), and Welsh (79.0%, a difference of 0.040%).
| Demographics | Rating | Rank | In Labor Force | Age 20-64 |
| Alsatians | 5.7 /100 | #229 | Tragic 79.1% |
| Native Hawaiians | 5.6 /100 | #230 | Tragic 79.1% |
| Lebanese | 5.1 /100 | #231 | Tragic 79.1% |
| Guamanians/Chamorros | 4.5 /100 | #232 | Tragic 79.1% |
| Japanese | 4.0 /100 | #233 | Tragic 79.1% |
| Immigrants | Canada | 3.2 /100 | #234 | Tragic 79.0% |
| Tlingit-Haida | 3.2 /100 | #235 | Tragic 79.0% |
| Samoans | 2.9 /100 | #236 | Tragic 79.0% |
| Immigrants | North America | 2.9 /100 | #237 | Tragic 79.0% |
| Immigrants | Jamaica | 2.6 /100 | #238 | Tragic 79.0% |
| Welsh | 2.4 /100 | #239 | Tragic 79.0% |
| Trinidadians and Tobagonians | 2.3 /100 | #240 | Tragic 79.0% |
| Jamaicans | 2.0 /100 | #241 | Tragic 78.9% |
| Immigrants | Micronesia | 1.9 /100 | #242 | Tragic 78.9% |
| Immigrants | West Indies | 1.7 /100 | #243 | Tragic 78.9% |