Aleut vs New Zealander In Labor Force | Age 20-24
COMPARE
Aleut
New Zealander
In Labor Force | Age 20-24
In Labor Force | Age 20-24 Comparison
Aleuts
New Zealanders
79.0%
IN LABOR FORCE | AGE 20-24
100.0/ 100
METRIC RATING
5th/ 347
METRIC RANK
75.2%
IN LABOR FORCE | AGE 20-24
65.4/ 100
METRIC RATING
161st/ 347
METRIC RANK
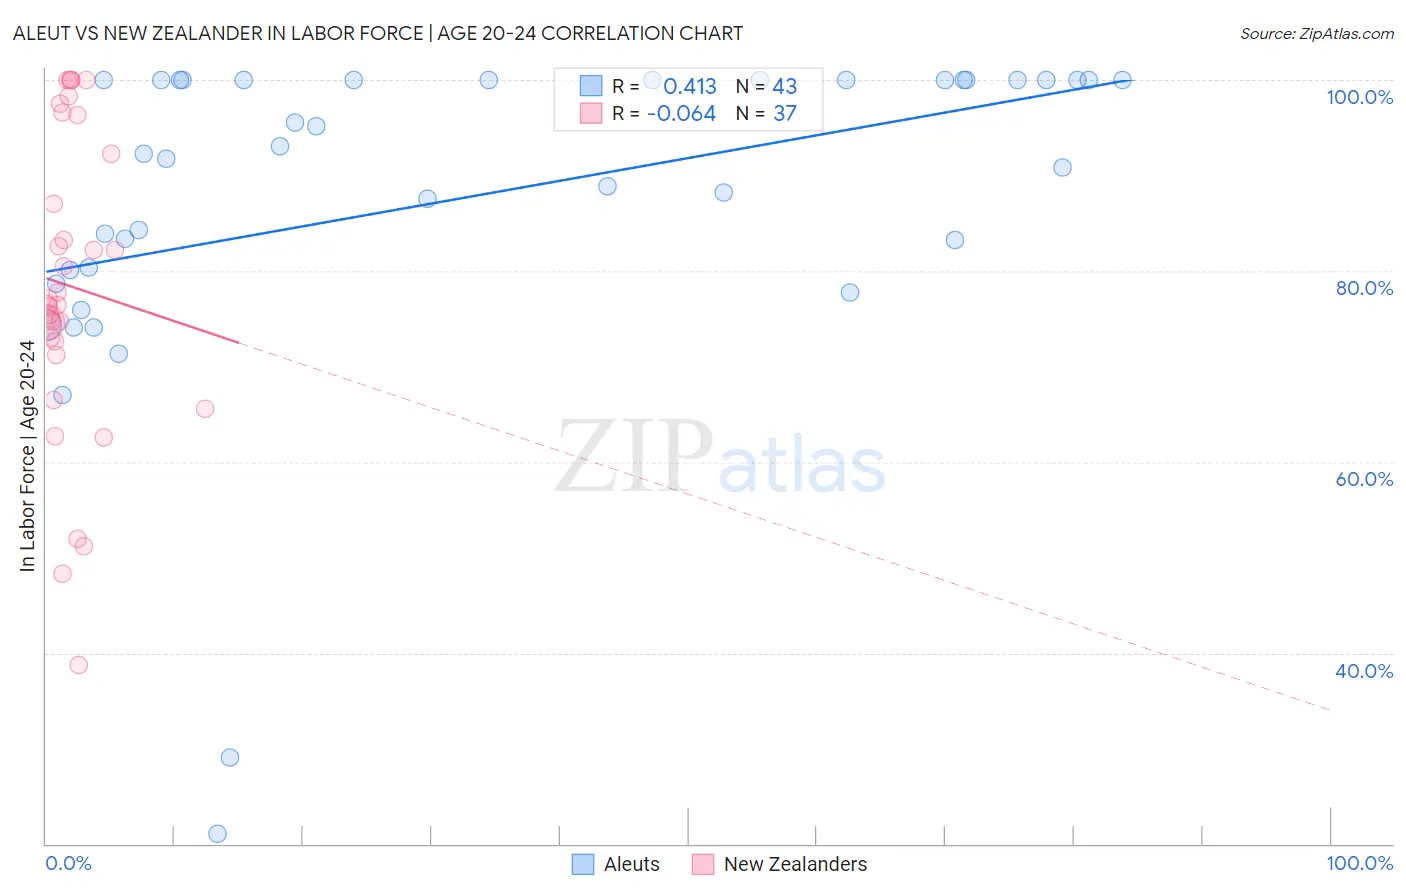
Aleut vs New Zealander In Labor Force | Age 20-24 Correlation Chart
The statistical analysis conducted on geographies consisting of 61,769,180 people shows a moderate positive correlation between the proportion of Aleuts and labor force participation rate among population between the ages 20 and 24 in the United States with a correlation coefficient (R) of 0.413 and weighted average of 79.0%. Similarly, the statistical analysis conducted on geographies consisting of 106,909,233 people shows a slight negative correlation between the proportion of New Zealanders and labor force participation rate among population between the ages 20 and 24 in the United States with a correlation coefficient (R) of -0.064 and weighted average of 75.2%, a difference of 5.0%.
In Labor Force | Age 20-24 Correlation Summary
| Measurement | Aleut | New Zealander |
| Minimum | 21.1% | 38.7% |
| Maximum | 100.0% | 100.0% |
| Range | 78.9% | 61.3% |
| Mean | 87.5% | 78.4% |
| Median | 92.3% | 76.4% |
| Interquartile 25% (IQ1) | 80.1% | 71.9% |
| Interquartile 75% (IQ3) | 100.0% | 94.3% |
| Interquartile Range (IQR) | 19.9% | 22.4% |
| Standard Deviation (Sample) | 17.3% | 15.8% |
| Standard Deviation (Population) | 17.1% | 15.6% |
Similar Demographics by In Labor Force | Age 20-24
Demographics Similar to Aleuts by In Labor Force | Age 20-24
In terms of in labor force | age 20-24, the demographic groups most similar to Aleuts are Danish (79.0%, a difference of 0.010%), Luxembourger (79.0%, a difference of 0.050%), Alaskan Athabascan (79.1%, a difference of 0.14%), Immigrants from Cabo Verde (78.9%, a difference of 0.16%), and Swedish (78.8%, a difference of 0.22%).
| Demographics | Rating | Rank | In Labor Force | Age 20-24 |
| Norwegians | 100.0 /100 | #1 | Exceptional 80.1% |
| Immigrants | Somalia | 100.0 /100 | #2 | Exceptional 79.5% |
| Somalis | 100.0 /100 | #3 | Exceptional 79.3% |
| Alaskan Athabascans | 100.0 /100 | #4 | Exceptional 79.1% |
| Aleuts | 100.0 /100 | #5 | Exceptional 79.0% |
| Danes | 100.0 /100 | #6 | Exceptional 79.0% |
| Luxembourgers | 100.0 /100 | #7 | Exceptional 79.0% |
| Immigrants | Cabo Verde | 100.0 /100 | #8 | Exceptional 78.9% |
| Swedes | 100.0 /100 | #9 | Exceptional 78.8% |
| Slovenes | 100.0 /100 | #10 | Exceptional 78.7% |
| Finns | 100.0 /100 | #11 | Exceptional 78.7% |
| Germans | 100.0 /100 | #12 | Exceptional 78.6% |
| Scandinavians | 100.0 /100 | #13 | Exceptional 78.5% |
| Czechs | 100.0 /100 | #14 | Exceptional 78.5% |
| Sudanese | 100.0 /100 | #15 | Exceptional 78.4% |
Demographics Similar to New Zealanders by In Labor Force | Age 20-24
In terms of in labor force | age 20-24, the demographic groups most similar to New Zealanders are Immigrants from Romania (75.2%, a difference of 0.010%), Costa Rican (75.2%, a difference of 0.020%), Bolivian (75.2%, a difference of 0.020%), Afghan (75.2%, a difference of 0.030%), and Japanese (75.3%, a difference of 0.050%).
| Demographics | Rating | Rank | In Labor Force | Age 20-24 |
| Osage | 72.3 /100 | #154 | Good 75.3% |
| Immigrants | Guatemala | 71.9 /100 | #155 | Good 75.3% |
| Immigrants | El Salvador | 71.7 /100 | #156 | Good 75.3% |
| Immigrants | Western Europe | 71.5 /100 | #157 | Good 75.3% |
| Immigrants | Bolivia | 71.0 /100 | #158 | Good 75.3% |
| South American Indians | 69.0 /100 | #159 | Good 75.3% |
| Japanese | 68.7 /100 | #160 | Good 75.3% |
| New Zealanders | 65.4 /100 | #161 | Good 75.2% |
| Immigrants | Romania | 64.6 /100 | #162 | Good 75.2% |
| Costa Ricans | 64.2 /100 | #163 | Good 75.2% |
| Bolivians | 64.0 /100 | #164 | Good 75.2% |
| Afghans | 63.5 /100 | #165 | Good 75.2% |
| Cambodians | 60.5 /100 | #166 | Good 75.2% |
| Immigrants | South Eastern Asia | 57.5 /100 | #167 | Average 75.1% |
| Immigrants | Western Africa | 56.7 /100 | #168 | Average 75.1% |