Aleut vs Cherokee In Labor Force | Age 20-24
COMPARE
Aleut
Cherokee
In Labor Force | Age 20-24
In Labor Force | Age 20-24 Comparison
Aleuts
Cherokee
79.0%
IN LABOR FORCE | AGE 20-24
100.0/ 100
METRIC RATING
5th/ 347
METRIC RANK
75.9%
IN LABOR FORCE | AGE 20-24
95.8/ 100
METRIC RATING
109th/ 347
METRIC RANK
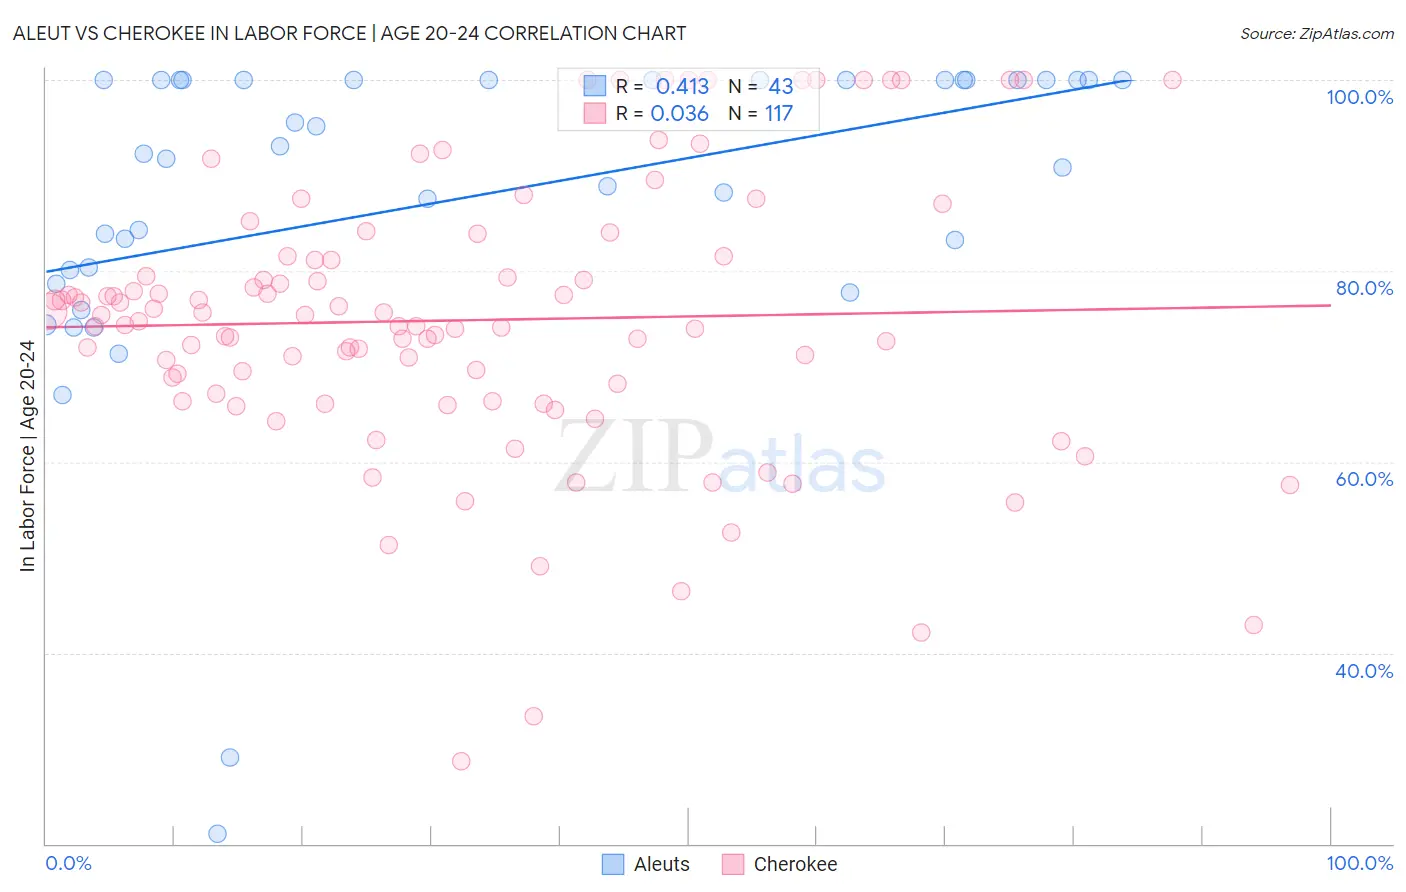
Aleut vs Cherokee In Labor Force | Age 20-24 Correlation Chart
The statistical analysis conducted on geographies consisting of 61,769,180 people shows a moderate positive correlation between the proportion of Aleuts and labor force participation rate among population between the ages 20 and 24 in the United States with a correlation coefficient (R) of 0.413 and weighted average of 79.0%. Similarly, the statistical analysis conducted on geographies consisting of 493,178,000 people shows no correlation between the proportion of Cherokee and labor force participation rate among population between the ages 20 and 24 in the United States with a correlation coefficient (R) of 0.036 and weighted average of 75.9%, a difference of 4.1%.
In Labor Force | Age 20-24 Correlation Summary
| Measurement | Aleut | Cherokee |
| Minimum | 21.1% | 28.6% |
| Maximum | 100.0% | 100.0% |
| Range | 78.9% | 71.4% |
| Mean | 87.5% | 74.8% |
| Median | 92.3% | 74.7% |
| Interquartile 25% (IQ1) | 80.1% | 66.8% |
| Interquartile 75% (IQ3) | 100.0% | 81.3% |
| Interquartile Range (IQR) | 19.9% | 14.6% |
| Standard Deviation (Sample) | 17.3% | 14.4% |
| Standard Deviation (Population) | 17.1% | 14.4% |
Similar Demographics by In Labor Force | Age 20-24
Demographics Similar to Aleuts by In Labor Force | Age 20-24
In terms of in labor force | age 20-24, the demographic groups most similar to Aleuts are Danish (79.0%, a difference of 0.010%), Luxembourger (79.0%, a difference of 0.050%), Alaskan Athabascan (79.1%, a difference of 0.14%), Immigrants from Cabo Verde (78.9%, a difference of 0.16%), and Swedish (78.8%, a difference of 0.22%).
| Demographics | Rating | Rank | In Labor Force | Age 20-24 |
| Norwegians | 100.0 /100 | #1 | Exceptional 80.1% |
| Immigrants | Somalia | 100.0 /100 | #2 | Exceptional 79.5% |
| Somalis | 100.0 /100 | #3 | Exceptional 79.3% |
| Alaskan Athabascans | 100.0 /100 | #4 | Exceptional 79.1% |
| Aleuts | 100.0 /100 | #5 | Exceptional 79.0% |
| Danes | 100.0 /100 | #6 | Exceptional 79.0% |
| Luxembourgers | 100.0 /100 | #7 | Exceptional 79.0% |
| Immigrants | Cabo Verde | 100.0 /100 | #8 | Exceptional 78.9% |
| Swedes | 100.0 /100 | #9 | Exceptional 78.8% |
| Slovenes | 100.0 /100 | #10 | Exceptional 78.7% |
| Finns | 100.0 /100 | #11 | Exceptional 78.7% |
| Germans | 100.0 /100 | #12 | Exceptional 78.6% |
| Scandinavians | 100.0 /100 | #13 | Exceptional 78.5% |
| Czechs | 100.0 /100 | #14 | Exceptional 78.5% |
| Sudanese | 100.0 /100 | #15 | Exceptional 78.4% |
Demographics Similar to Cherokee by In Labor Force | Age 20-24
In terms of in labor force | age 20-24, the demographic groups most similar to Cherokee are Immigrants from Morocco (75.9%, a difference of 0.0%), Ukrainian (75.9%, a difference of 0.010%), Immigrants from Canada (75.9%, a difference of 0.020%), Immigrants from Netherlands (75.9%, a difference of 0.050%), and Immigrants from Zimbabwe (75.9%, a difference of 0.060%).
| Demographics | Rating | Rank | In Labor Force | Age 20-24 |
| Latvians | 97.6 /100 | #102 | Exceptional 76.1% |
| Immigrants | North Macedonia | 97.5 /100 | #103 | Exceptional 76.1% |
| Macedonians | 97.2 /100 | #104 | Exceptional 76.0% |
| Immigrants | Nepal | 97.2 /100 | #105 | Exceptional 76.0% |
| Immigrants | Uganda | 97.1 /100 | #106 | Exceptional 76.0% |
| Greeks | 96.9 /100 | #107 | Exceptional 76.0% |
| Iraqis | 96.6 /100 | #108 | Exceptional 76.0% |
| Cherokee | 95.8 /100 | #109 | Exceptional 75.9% |
| Immigrants | Morocco | 95.8 /100 | #110 | Exceptional 75.9% |
| Ukrainians | 95.7 /100 | #111 | Exceptional 75.9% |
| Immigrants | Canada | 95.6 /100 | #112 | Exceptional 75.9% |
| Immigrants | Netherlands | 95.3 /100 | #113 | Exceptional 75.9% |
| Immigrants | Zimbabwe | 95.1 /100 | #114 | Exceptional 75.9% |
| Alaska Natives | 95.1 /100 | #115 | Exceptional 75.9% |
| Immigrants | North America | 95.0 /100 | #116 | Exceptional 75.9% |