Belgian vs African In Labor Force | Age 45-54
COMPARE
Belgian
African
In Labor Force | Age 45-54
In Labor Force | Age 45-54 Comparison
Belgians
Africans
83.4%
IN LABOR FORCE | AGE 45-54
96.5/ 100
METRIC RATING
79th/ 347
METRIC RANK
80.5%
IN LABOR FORCE | AGE 45-54
0.0/ 100
METRIC RATING
296th/ 347
METRIC RANK
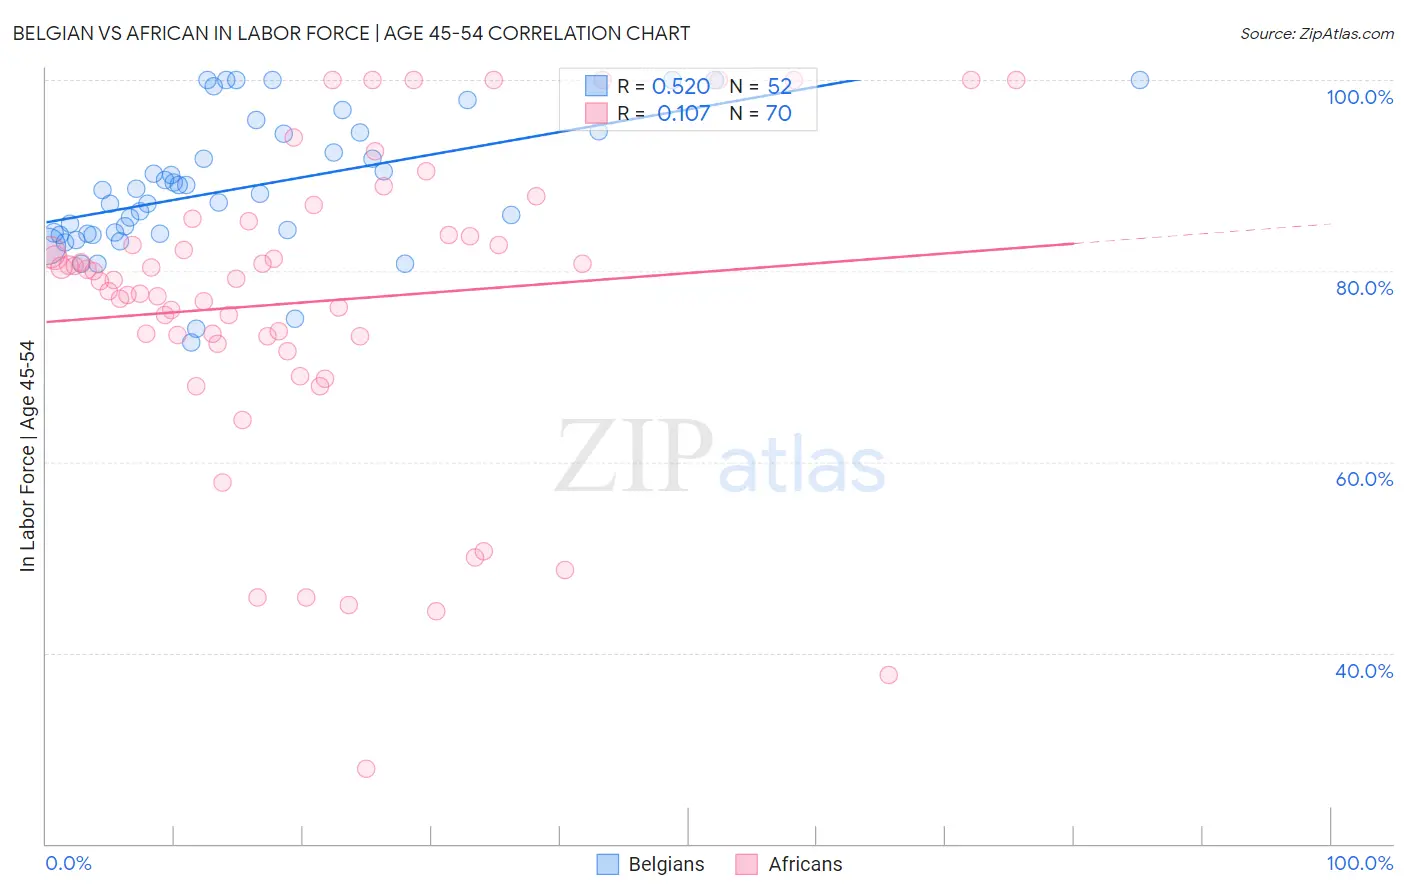
Belgian vs African In Labor Force | Age 45-54 Correlation Chart
The statistical analysis conducted on geographies consisting of 355,838,981 people shows a substantial positive correlation between the proportion of Belgians and labor force participation rate among population between the ages 45 and 54 in the United States with a correlation coefficient (R) of 0.520 and weighted average of 83.4%. Similarly, the statistical analysis conducted on geographies consisting of 469,587,122 people shows a poor positive correlation between the proportion of Africans and labor force participation rate among population between the ages 45 and 54 in the United States with a correlation coefficient (R) of 0.107 and weighted average of 80.5%, a difference of 3.5%.
In Labor Force | Age 45-54 Correlation Summary
| Measurement | Belgian | African |
| Minimum | 72.5% | 27.9% |
| Maximum | 100.0% | 100.0% |
| Range | 27.5% | 72.1% |
| Mean | 88.7% | 76.8% |
| Median | 88.3% | 79.1% |
| Interquartile 25% (IQ1) | 83.9% | 73.2% |
| Interquartile 75% (IQ3) | 94.5% | 83.8% |
| Interquartile Range (IQR) | 10.5% | 10.6% |
| Standard Deviation (Sample) | 7.1% | 15.9% |
| Standard Deviation (Population) | 7.0% | 15.8% |
Similar Demographics by In Labor Force | Age 45-54
Demographics Similar to Belgians by In Labor Force | Age 45-54
In terms of in labor force | age 45-54, the demographic groups most similar to Belgians are Immigrants from Croatia (83.4%, a difference of 0.0%), Cuban (83.4%, a difference of 0.010%), Immigrants from Egypt (83.4%, a difference of 0.010%), Jordanian (83.4%, a difference of 0.010%), and Estonian (83.4%, a difference of 0.020%).
| Demographics | Rating | Rank | In Labor Force | Age 45-54 |
| Serbians | 97.2 /100 | #72 | Exceptional 83.4% |
| Immigrants | Czechoslovakia | 97.1 /100 | #73 | Exceptional 83.4% |
| Immigrants | Somalia | 96.9 /100 | #74 | Exceptional 83.4% |
| Estonians | 96.9 /100 | #75 | Exceptional 83.4% |
| Russians | 96.8 /100 | #76 | Exceptional 83.4% |
| Cubans | 96.7 /100 | #77 | Exceptional 83.4% |
| Immigrants | Egypt | 96.6 /100 | #78 | Exceptional 83.4% |
| Belgians | 96.5 /100 | #79 | Exceptional 83.4% |
| Immigrants | Croatia | 96.5 /100 | #80 | Exceptional 83.4% |
| Jordanians | 96.4 /100 | #81 | Exceptional 83.4% |
| Immigrants | Eastern Asia | 96.3 /100 | #82 | Exceptional 83.4% |
| Immigrants | Zimbabwe | 96.3 /100 | #83 | Exceptional 83.4% |
| Immigrants | Bosnia and Herzegovina | 96.0 /100 | #84 | Exceptional 83.3% |
| Greeks | 95.9 /100 | #85 | Exceptional 83.3% |
| Immigrants | Northern Africa | 95.7 /100 | #86 | Exceptional 83.3% |
Demographics Similar to Africans by In Labor Force | Age 45-54
In terms of in labor force | age 45-54, the demographic groups most similar to Africans are Nepalese (80.5%, a difference of 0.040%), Osage (80.6%, a difference of 0.10%), Yakama (80.6%, a difference of 0.10%), Iroquois (80.6%, a difference of 0.12%), and Immigrants from Belize (80.6%, a difference of 0.15%).
| Demographics | Rating | Rank | In Labor Force | Age 45-54 |
| Immigrants | Bangladesh | 0.0 /100 | #289 | Tragic 80.7% |
| Mexican American Indians | 0.0 /100 | #290 | Tragic 80.7% |
| Immigrants | Belize | 0.0 /100 | #291 | Tragic 80.6% |
| Iroquois | 0.0 /100 | #292 | Tragic 80.6% |
| Osage | 0.0 /100 | #293 | Tragic 80.6% |
| Yakama | 0.0 /100 | #294 | Tragic 80.6% |
| Nepalese | 0.0 /100 | #295 | Tragic 80.5% |
| Africans | 0.0 /100 | #296 | Tragic 80.5% |
| Americans | 0.0 /100 | #297 | Tragic 80.4% |
| Marshallese | 0.0 /100 | #298 | Tragic 80.3% |
| Dominicans | 0.0 /100 | #299 | Tragic 80.3% |
| Fijians | 0.0 /100 | #300 | Tragic 80.2% |
| Spanish American Indians | 0.0 /100 | #301 | Tragic 80.2% |
| Immigrants | Central America | 0.0 /100 | #302 | Tragic 80.2% |
| Immigrants | Azores | 0.0 /100 | #303 | Tragic 80.1% |