Albanian vs Immigrants from North Macedonia In Labor Force | Age 16-19
COMPARE
Albanian
Immigrants from North Macedonia
In Labor Force | Age 16-19
In Labor Force | Age 16-19 Comparison
Albanians
Immigrants from North Macedonia
36.5%
IN LABOR FORCE | AGE 16-19
48.8/ 100
METRIC RATING
176th/ 347
METRIC RANK
38.9%
IN LABOR FORCE | AGE 16-19
99.3/ 100
METRIC RATING
99th/ 347
METRIC RANK
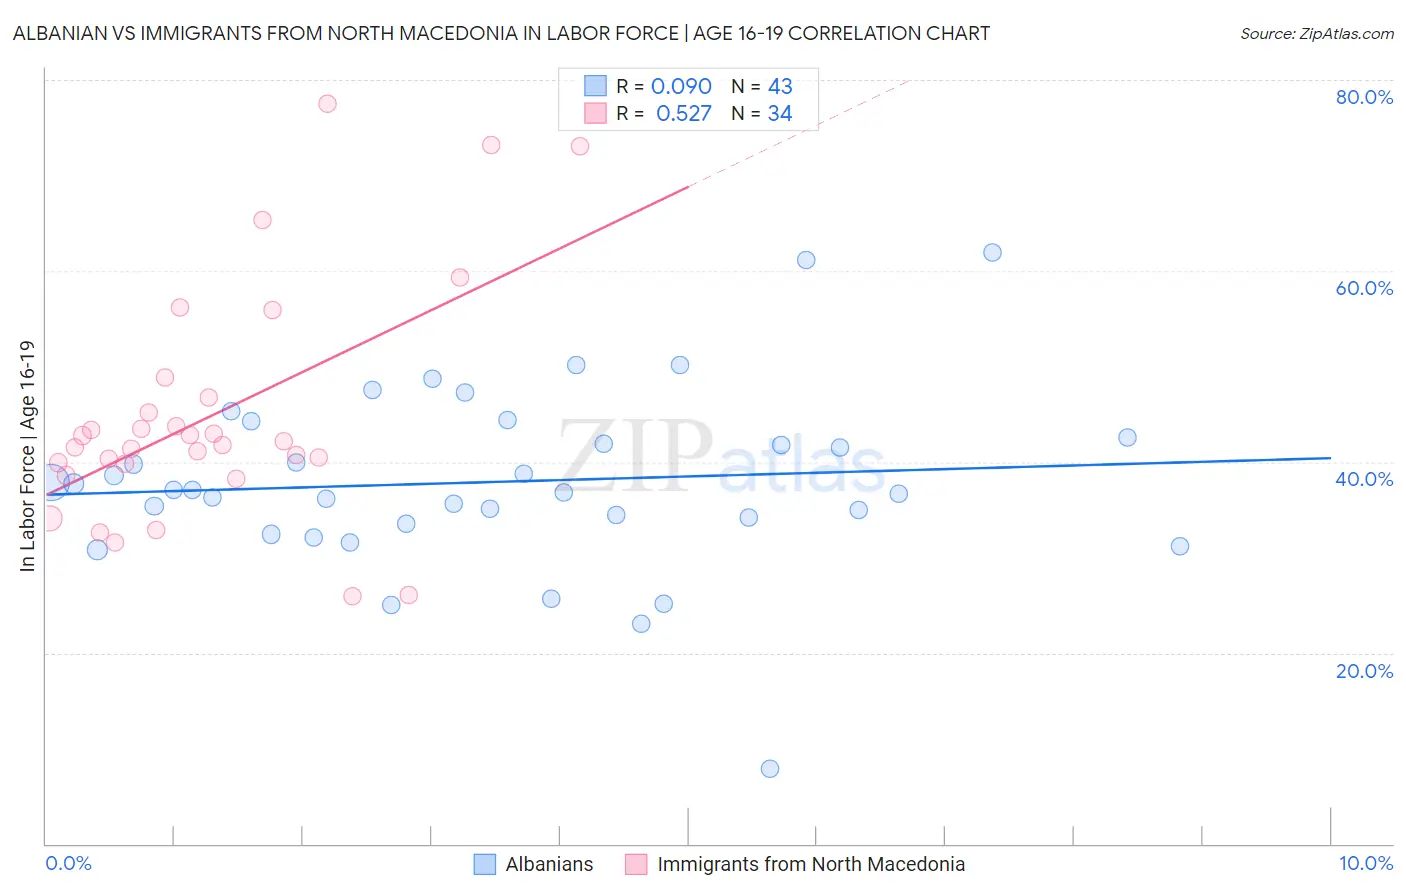
Albanian vs Immigrants from North Macedonia In Labor Force | Age 16-19 Correlation Chart
The statistical analysis conducted on geographies consisting of 193,105,340 people shows a slight positive correlation between the proportion of Albanians and labor force participation rate among population between the ages 16 and 19 in the United States with a correlation coefficient (R) of 0.090 and weighted average of 36.5%. Similarly, the statistical analysis conducted on geographies consisting of 74,262,337 people shows a substantial positive correlation between the proportion of Immigrants from North Macedonia and labor force participation rate among population between the ages 16 and 19 in the United States with a correlation coefficient (R) of 0.527 and weighted average of 38.9%, a difference of 6.3%.
In Labor Force | Age 16-19 Correlation Summary
| Measurement | Albanian | Immigrants from North Macedonia |
| Minimum | 7.8% | 25.9% |
| Maximum | 61.9% | 77.6% |
| Range | 54.1% | 51.7% |
| Mean | 37.9% | 45.0% |
| Median | 37.0% | 42.0% |
| Interquartile 25% (IQ1) | 33.5% | 39.8% |
| Interquartile 75% (IQ3) | 42.5% | 46.7% |
| Interquartile Range (IQR) | 9.0% | 7.0% |
| Standard Deviation (Sample) | 9.5% | 12.5% |
| Standard Deviation (Population) | 9.4% | 12.3% |
Similar Demographics by In Labor Force | Age 16-19
Demographics Similar to Albanians by In Labor Force | Age 16-19
In terms of in labor force | age 16-19, the demographic groups most similar to Albanians are Native/Alaskan (36.6%, a difference of 0.010%), Immigrants from Czechoslovakia (36.6%, a difference of 0.060%), Immigrants from Northern Europe (36.5%, a difference of 0.11%), Black/African American (36.5%, a difference of 0.19%), and Immigrants from Southern Europe (36.4%, a difference of 0.28%).
| Demographics | Rating | Rank | In Labor Force | Age 16-19 |
| Immigrants | Latvia | 61.6 /100 | #169 | Good 36.8% |
| Immigrants | South Africa | 60.5 /100 | #170 | Good 36.8% |
| Immigrants | Cambodia | 58.4 /100 | #171 | Average 36.7% |
| South Africans | 58.3 /100 | #172 | Average 36.7% |
| Russians | 57.5 /100 | #173 | Average 36.7% |
| Immigrants | Czechoslovakia | 50.0 /100 | #174 | Average 36.6% |
| Natives/Alaskans | 49.0 /100 | #175 | Average 36.6% |
| Albanians | 48.8 /100 | #176 | Average 36.5% |
| Immigrants | Northern Europe | 46.6 /100 | #177 | Average 36.5% |
| Blacks/African Americans | 45.1 /100 | #178 | Average 36.5% |
| Immigrants | Southern Europe | 43.3 /100 | #179 | Average 36.4% |
| Immigrants | Morocco | 41.1 /100 | #180 | Average 36.4% |
| Jordanians | 39.6 /100 | #181 | Fair 36.4% |
| Immigrants | Italy | 39.1 /100 | #182 | Fair 36.4% |
| Eastern Europeans | 38.8 /100 | #183 | Fair 36.4% |
Demographics Similar to Immigrants from North Macedonia by In Labor Force | Age 16-19
In terms of in labor force | age 16-19, the demographic groups most similar to Immigrants from North Macedonia are Ugandan (38.9%, a difference of 0.020%), Greek (38.9%, a difference of 0.030%), Latvian (38.9%, a difference of 0.070%), Immigrants from North America (38.9%, a difference of 0.10%), and Blackfeet (38.9%, a difference of 0.19%).
| Demographics | Rating | Rank | In Labor Force | Age 16-19 |
| Osage | 99.4 /100 | #92 | Exceptional 39.0% |
| Blackfeet | 99.4 /100 | #93 | Exceptional 38.9% |
| Immigrants | Canada | 99.4 /100 | #94 | Exceptional 38.9% |
| Immigrants | North America | 99.4 /100 | #95 | Exceptional 38.9% |
| Latvians | 99.4 /100 | #96 | Exceptional 38.9% |
| Greeks | 99.3 /100 | #97 | Exceptional 38.9% |
| Ugandans | 99.3 /100 | #98 | Exceptional 38.9% |
| Immigrants | North Macedonia | 99.3 /100 | #99 | Exceptional 38.9% |
| Immigrants | Thailand | 99.1 /100 | #100 | Exceptional 38.7% |
| Hmong | 99.1 /100 | #101 | Exceptional 38.7% |
| Zimbabweans | 99.1 /100 | #102 | Exceptional 38.7% |
| Immigrants | Cameroon | 99.0 /100 | #103 | Exceptional 38.7% |
| Immigrants | Eritrea | 99.0 /100 | #104 | Exceptional 38.7% |
| Iraqis | 98.9 /100 | #105 | Exceptional 38.6% |
| Delaware | 98.8 /100 | #106 | Exceptional 38.6% |