Albanian vs Chickasaw In Labor Force | Age 16-19
COMPARE
Albanian
Chickasaw
In Labor Force | Age 16-19
In Labor Force | Age 16-19 Comparison
Albanians
Chickasaw
36.5%
IN LABOR FORCE | AGE 16-19
48.8/ 100
METRIC RATING
176th/ 347
METRIC RANK
38.3%
IN LABOR FORCE | AGE 16-19
97.8/ 100
METRIC RATING
117th/ 347
METRIC RANK
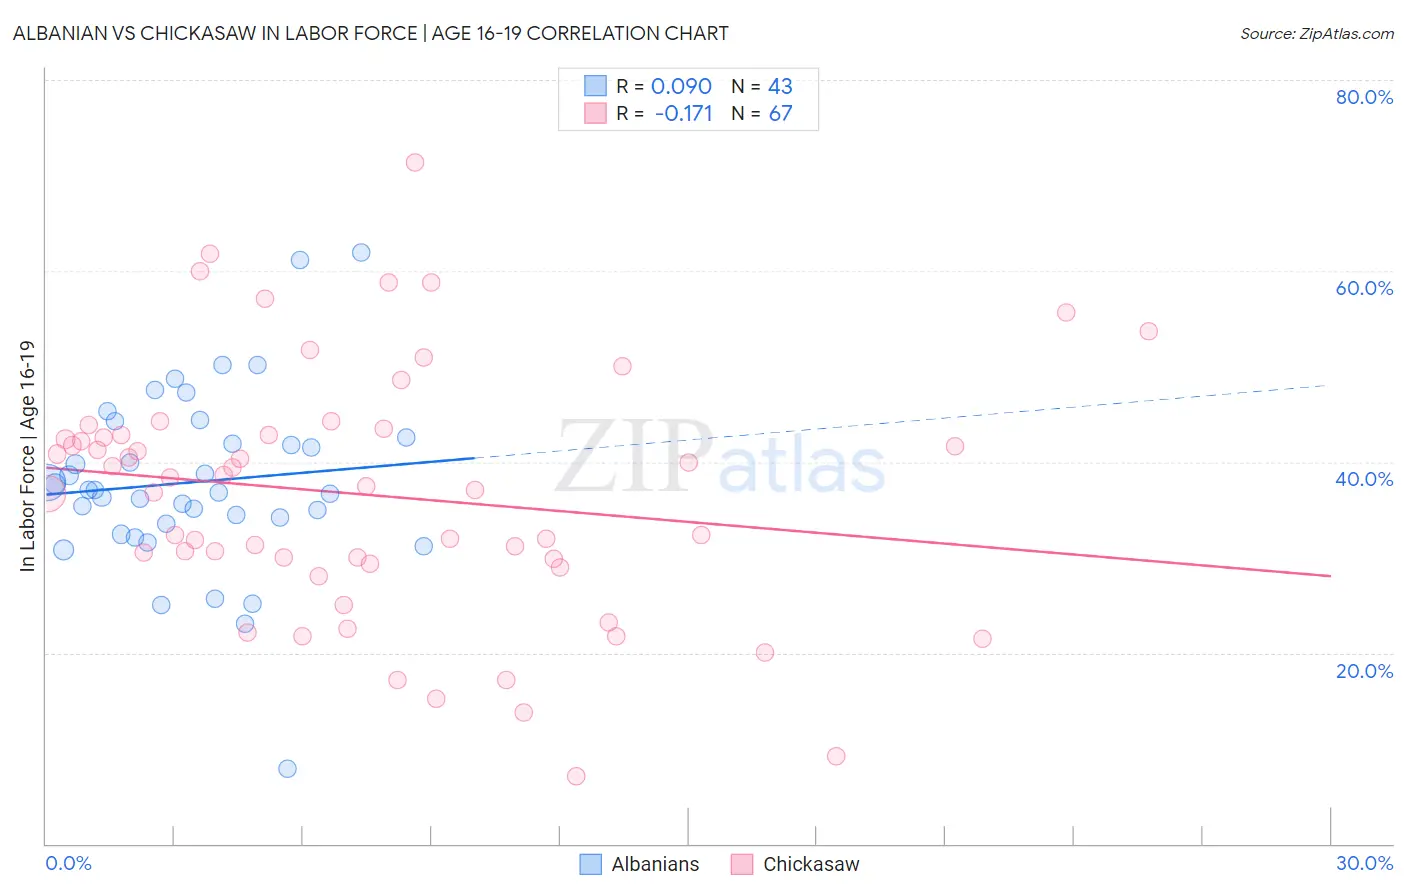
Albanian vs Chickasaw In Labor Force | Age 16-19 Correlation Chart
The statistical analysis conducted on geographies consisting of 193,105,340 people shows a slight positive correlation between the proportion of Albanians and labor force participation rate among population between the ages 16 and 19 in the United States with a correlation coefficient (R) of 0.090 and weighted average of 36.5%. Similarly, the statistical analysis conducted on geographies consisting of 147,579,210 people shows a poor negative correlation between the proportion of Chickasaw and labor force participation rate among population between the ages 16 and 19 in the United States with a correlation coefficient (R) of -0.171 and weighted average of 38.3%, a difference of 4.9%.
In Labor Force | Age 16-19 Correlation Summary
| Measurement | Albanian | Chickasaw |
| Minimum | 7.8% | 7.1% |
| Maximum | 61.9% | 71.4% |
| Range | 54.1% | 64.3% |
| Mean | 37.9% | 36.5% |
| Median | 37.0% | 37.5% |
| Interquartile 25% (IQ1) | 33.5% | 29.4% |
| Interquartile 75% (IQ3) | 42.5% | 42.8% |
| Interquartile Range (IQR) | 9.0% | 13.5% |
| Standard Deviation (Sample) | 9.5% | 13.1% |
| Standard Deviation (Population) | 9.4% | 13.0% |
Similar Demographics by In Labor Force | Age 16-19
Demographics Similar to Albanians by In Labor Force | Age 16-19
In terms of in labor force | age 16-19, the demographic groups most similar to Albanians are Native/Alaskan (36.6%, a difference of 0.010%), Immigrants from Czechoslovakia (36.6%, a difference of 0.060%), Immigrants from Northern Europe (36.5%, a difference of 0.11%), Black/African American (36.5%, a difference of 0.19%), and Immigrants from Southern Europe (36.4%, a difference of 0.28%).
| Demographics | Rating | Rank | In Labor Force | Age 16-19 |
| Immigrants | Latvia | 61.6 /100 | #169 | Good 36.8% |
| Immigrants | South Africa | 60.5 /100 | #170 | Good 36.8% |
| Immigrants | Cambodia | 58.4 /100 | #171 | Average 36.7% |
| South Africans | 58.3 /100 | #172 | Average 36.7% |
| Russians | 57.5 /100 | #173 | Average 36.7% |
| Immigrants | Czechoslovakia | 50.0 /100 | #174 | Average 36.6% |
| Natives/Alaskans | 49.0 /100 | #175 | Average 36.6% |
| Albanians | 48.8 /100 | #176 | Average 36.5% |
| Immigrants | Northern Europe | 46.6 /100 | #177 | Average 36.5% |
| Blacks/African Americans | 45.1 /100 | #178 | Average 36.5% |
| Immigrants | Southern Europe | 43.3 /100 | #179 | Average 36.4% |
| Immigrants | Morocco | 41.1 /100 | #180 | Average 36.4% |
| Jordanians | 39.6 /100 | #181 | Fair 36.4% |
| Immigrants | Italy | 39.1 /100 | #182 | Fair 36.4% |
| Eastern Europeans | 38.8 /100 | #183 | Fair 36.4% |
Demographics Similar to Chickasaw by In Labor Force | Age 16-19
In terms of in labor force | age 16-19, the demographic groups most similar to Chickasaw are Immigrants from Nepal (38.3%, a difference of 0.010%), Assyrian/Chaldean/Syriac (38.3%, a difference of 0.030%), Colville (38.3%, a difference of 0.050%), Bulgarian (38.3%, a difference of 0.060%), and Ukrainian (38.3%, a difference of 0.11%).
| Demographics | Rating | Rank | In Labor Force | Age 16-19 |
| Maltese | 98.6 /100 | #110 | Exceptional 38.5% |
| Crow | 98.5 /100 | #111 | Exceptional 38.5% |
| Immigrants | Scotland | 98.5 /100 | #112 | Exceptional 38.5% |
| Sub-Saharan Africans | 98.3 /100 | #113 | Exceptional 38.4% |
| Hawaiians | 98.2 /100 | #114 | Exceptional 38.4% |
| Bulgarians | 97.9 /100 | #115 | Exceptional 38.3% |
| Colville | 97.9 /100 | #116 | Exceptional 38.3% |
| Chickasaw | 97.8 /100 | #117 | Exceptional 38.3% |
| Immigrants | Nepal | 97.8 /100 | #118 | Exceptional 38.3% |
| Assyrians/Chaldeans/Syriacs | 97.8 /100 | #119 | Exceptional 38.3% |
| Ukrainians | 97.6 /100 | #120 | Exceptional 38.3% |
| Ethiopians | 97.4 /100 | #121 | Exceptional 38.2% |
| Guamanians/Chamorros | 97.4 /100 | #122 | Exceptional 38.2% |
| Seminole | 96.7 /100 | #123 | Exceptional 38.1% |
| Immigrants | England | 96.4 /100 | #124 | Exceptional 38.1% |