Alaskan Athabascan vs Okinawan In Labor Force | Age 20-64
COMPARE
Alaskan Athabascan
Okinawan
In Labor Force | Age 20-64
In Labor Force | Age 20-64 Comparison
Alaskan Athabascans
Okinawans
76.9%
IN LABOR FORCE | AGE 20-64
0.0/ 100
METRIC RATING
312th/ 347
METRIC RANK
79.6%
IN LABOR FORCE | AGE 20-64
62.7/ 100
METRIC RATING
166th/ 347
METRIC RANK
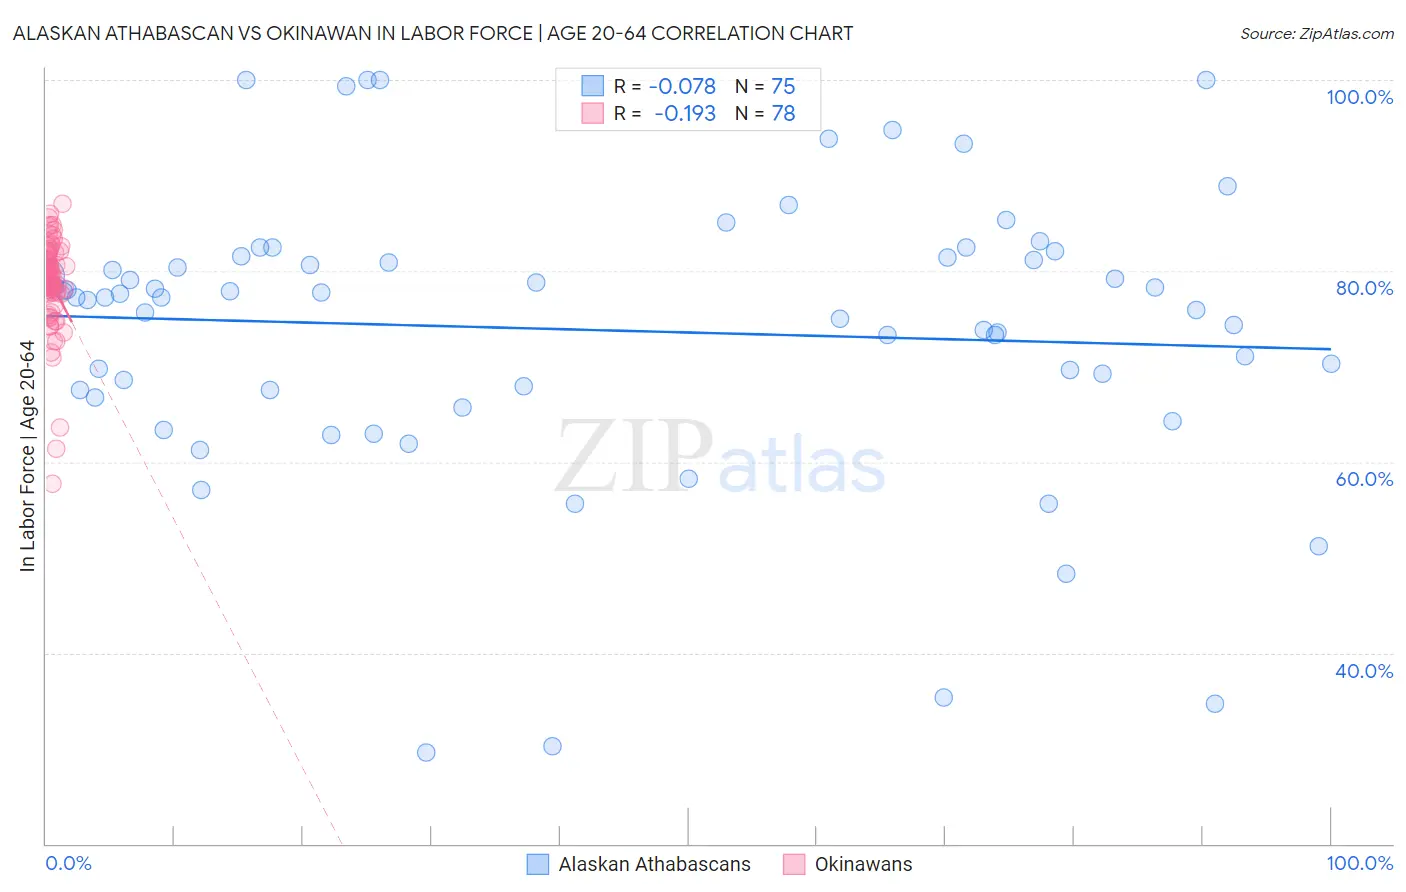
Alaskan Athabascan vs Okinawan In Labor Force | Age 20-64 Correlation Chart
The statistical analysis conducted on geographies consisting of 45,821,503 people shows a slight negative correlation between the proportion of Alaskan Athabascans and labor force participation rate among population between the ages 20 and 64 in the United States with a correlation coefficient (R) of -0.078 and weighted average of 76.9%. Similarly, the statistical analysis conducted on geographies consisting of 73,775,632 people shows a poor negative correlation between the proportion of Okinawans and labor force participation rate among population between the ages 20 and 64 in the United States with a correlation coefficient (R) of -0.193 and weighted average of 79.6%, a difference of 3.6%.
In Labor Force | Age 20-64 Correlation Summary
| Measurement | Alaskan Athabascan | Okinawan |
| Minimum | 29.5% | 57.7% |
| Maximum | 100.0% | 87.0% |
| Range | 70.5% | 29.3% |
| Mean | 73.8% | 78.7% |
| Median | 77.2% | 79.4% |
| Interquartile 25% (IQ1) | 67.5% | 77.7% |
| Interquartile 75% (IQ3) | 81.4% | 81.9% |
| Interquartile Range (IQR) | 13.9% | 4.2% |
| Standard Deviation (Sample) | 15.0% | 5.0% |
| Standard Deviation (Population) | 14.9% | 4.9% |
Similar Demographics by In Labor Force | Age 20-64
Demographics Similar to Alaskan Athabascans by In Labor Force | Age 20-64
In terms of in labor force | age 20-64, the demographic groups most similar to Alaskan Athabascans are Shoshone (76.8%, a difference of 0.12%), Black/African American (76.8%, a difference of 0.14%), Blackfeet (77.0%, a difference of 0.17%), Comanche (77.0%, a difference of 0.21%), and American (77.0%, a difference of 0.22%).
| Demographics | Rating | Rank | In Labor Force | Age 20-64 |
| Mexicans | 0.0 /100 | #305 | Tragic 77.2% |
| Potawatomi | 0.0 /100 | #306 | Tragic 77.2% |
| Central American Indians | 0.0 /100 | #307 | Tragic 77.1% |
| Alaska Natives | 0.0 /100 | #308 | Tragic 77.0% |
| Americans | 0.0 /100 | #309 | Tragic 77.0% |
| Comanche | 0.0 /100 | #310 | Tragic 77.0% |
| Blackfeet | 0.0 /100 | #311 | Tragic 77.0% |
| Alaskan Athabascans | 0.0 /100 | #312 | Tragic 76.9% |
| Shoshone | 0.0 /100 | #313 | Tragic 76.8% |
| Blacks/African Americans | 0.0 /100 | #314 | Tragic 76.8% |
| Ottawa | 0.0 /100 | #315 | Tragic 76.7% |
| Yaqui | 0.0 /100 | #316 | Tragic 76.5% |
| Cherokee | 0.0 /100 | #317 | Tragic 76.2% |
| Chickasaw | 0.0 /100 | #318 | Tragic 76.2% |
| Inupiat | 0.0 /100 | #319 | Tragic 76.1% |
Demographics Similar to Okinawans by In Labor Force | Age 20-64
In terms of in labor force | age 20-64, the demographic groups most similar to Okinawans are Immigrants from Burma/Myanmar (79.7%, a difference of 0.010%), Nigerian (79.7%, a difference of 0.010%), Immigrants from Iraq (79.6%, a difference of 0.010%), Immigrants from Indonesia (79.6%, a difference of 0.010%), and German (79.7%, a difference of 0.020%).
| Demographics | Rating | Rank | In Labor Force | Age 20-64 |
| Immigrants | Cuba | 66.7 /100 | #159 | Good 79.7% |
| Moroccans | 66.7 /100 | #160 | Good 79.7% |
| South Africans | 66.2 /100 | #161 | Good 79.7% |
| Germans | 65.2 /100 | #162 | Good 79.7% |
| Immigrants | Costa Rica | 64.6 /100 | #163 | Good 79.7% |
| Immigrants | Burma/Myanmar | 64.4 /100 | #164 | Good 79.7% |
| Nigerians | 64.0 /100 | #165 | Good 79.7% |
| Okinawans | 62.7 /100 | #166 | Good 79.6% |
| Immigrants | Iraq | 62.0 /100 | #167 | Good 79.6% |
| Immigrants | Indonesia | 61.8 /100 | #168 | Good 79.6% |
| Laotians | 58.4 /100 | #169 | Average 79.6% |
| Slavs | 54.0 /100 | #170 | Average 79.6% |
| Immigrants | Switzerland | 53.3 /100 | #171 | Average 79.6% |
| Immigrants | Belgium | 53.1 /100 | #172 | Average 79.6% |
| Immigrants | Scotland | 52.4 /100 | #173 | Average 79.6% |