Alaskan Athabascan vs Yugoslavian In Labor Force | Age 25-29
COMPARE
Alaskan Athabascan
Yugoslavian
In Labor Force | Age 25-29
In Labor Force | Age 25-29 Comparison
Alaskan Athabascans
Yugoslavians
82.3%
IN LABOR FORCE | AGE 25-29
0.0/ 100
METRIC RATING
311th/ 347
METRIC RANK
85.6%
IN LABOR FORCE | AGE 25-29
99.8/ 100
METRIC RATING
50th/ 347
METRIC RANK
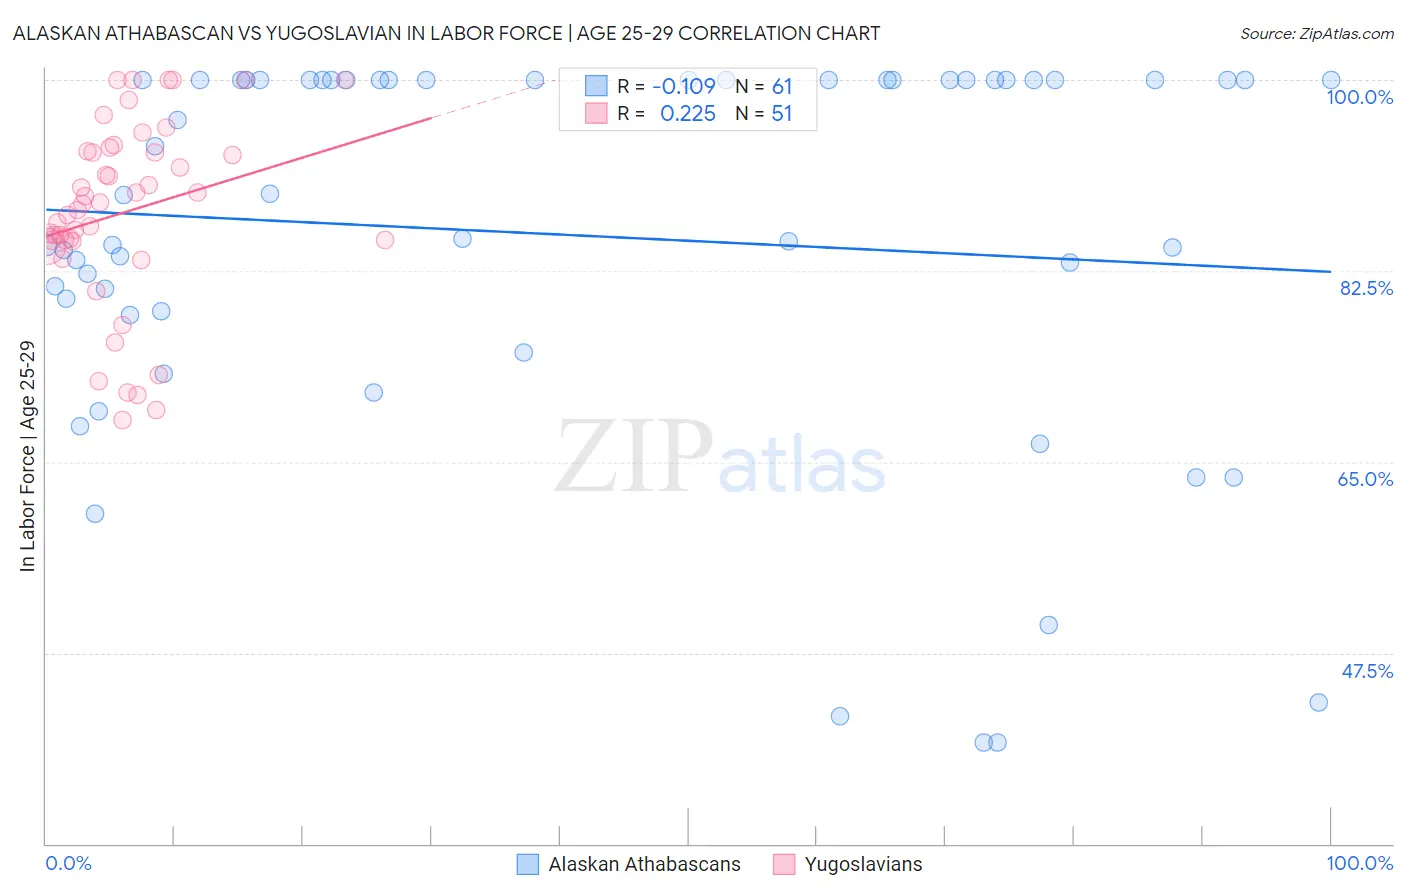
Alaskan Athabascan vs Yugoslavian In Labor Force | Age 25-29 Correlation Chart
The statistical analysis conducted on geographies consisting of 45,810,545 people shows a poor negative correlation between the proportion of Alaskan Athabascans and labor force participation rate among population between the ages 25 and 29 in the United States with a correlation coefficient (R) of -0.109 and weighted average of 82.3%. Similarly, the statistical analysis conducted on geographies consisting of 285,642,405 people shows a weak positive correlation between the proportion of Yugoslavians and labor force participation rate among population between the ages 25 and 29 in the United States with a correlation coefficient (R) of 0.225 and weighted average of 85.6%, a difference of 4.0%.
In Labor Force | Age 25-29 Correlation Summary
| Measurement | Alaskan Athabascan | Yugoslavian |
| Minimum | 39.3% | 68.8% |
| Maximum | 100.0% | 100.0% |
| Range | 60.7% | 31.2% |
| Mean | 85.8% | 87.9% |
| Median | 89.5% | 88.7% |
| Interquartile 25% (IQ1) | 78.6% | 85.2% |
| Interquartile 75% (IQ3) | 100.0% | 93.5% |
| Interquartile Range (IQR) | 21.4% | 8.3% |
| Standard Deviation (Sample) | 17.6% | 8.4% |
| Standard Deviation (Population) | 17.4% | 8.3% |
Similar Demographics by In Labor Force | Age 25-29
Demographics Similar to Alaskan Athabascans by In Labor Force | Age 25-29
In terms of in labor force | age 25-29, the demographic groups most similar to Alaskan Athabascans are Osage (82.3%, a difference of 0.010%), Hispanic or Latino (82.2%, a difference of 0.070%), Immigrants from Central America (82.4%, a difference of 0.15%), Central American Indian (82.4%, a difference of 0.16%), and Yaqui (82.2%, a difference of 0.17%).
| Demographics | Rating | Rank | In Labor Force | Age 25-29 |
| Immigrants | St. Vincent and the Grenadines | 0.0 /100 | #304 | Tragic 82.7% |
| Blacks/African Americans | 0.0 /100 | #305 | Tragic 82.6% |
| Blackfeet | 0.0 /100 | #306 | Tragic 82.6% |
| Cajuns | 0.0 /100 | #307 | Tragic 82.5% |
| Central American Indians | 0.0 /100 | #308 | Tragic 82.4% |
| Immigrants | Central America | 0.0 /100 | #309 | Tragic 82.4% |
| Osage | 0.0 /100 | #310 | Tragic 82.3% |
| Alaskan Athabascans | 0.0 /100 | #311 | Tragic 82.3% |
| Hispanics or Latinos | 0.0 /100 | #312 | Tragic 82.2% |
| Yaqui | 0.0 /100 | #313 | Tragic 82.2% |
| Cherokee | 0.0 /100 | #314 | Tragic 82.1% |
| Immigrants | Mexico | 0.0 /100 | #315 | Tragic 82.0% |
| Mexicans | 0.0 /100 | #316 | Tragic 81.9% |
| Chickasaw | 0.0 /100 | #317 | Tragic 81.9% |
| Comanche | 0.0 /100 | #318 | Tragic 81.9% |
Demographics Similar to Yugoslavians by In Labor Force | Age 25-29
In terms of in labor force | age 25-29, the demographic groups most similar to Yugoslavians are Immigrants from Latvia (85.6%, a difference of 0.0%), Swedish (85.6%, a difference of 0.030%), Immigrants from Poland (85.6%, a difference of 0.030%), Turkish (85.6%, a difference of 0.040%), and Italian (85.6%, a difference of 0.040%).
| Demographics | Rating | Rank | In Labor Force | Age 25-29 |
| Immigrants | India | 99.9 /100 | #43 | Exceptional 85.7% |
| Macedonians | 99.9 /100 | #44 | Exceptional 85.7% |
| Immigrants | Sierra Leone | 99.9 /100 | #45 | Exceptional 85.7% |
| Czechs | 99.8 /100 | #46 | Exceptional 85.6% |
| Turks | 99.8 /100 | #47 | Exceptional 85.6% |
| Italians | 99.8 /100 | #48 | Exceptional 85.6% |
| Swedes | 99.8 /100 | #49 | Exceptional 85.6% |
| Yugoslavians | 99.8 /100 | #50 | Exceptional 85.6% |
| Immigrants | Latvia | 99.8 /100 | #51 | Exceptional 85.6% |
| Immigrants | Poland | 99.7 /100 | #52 | Exceptional 85.6% |
| Belgians | 99.7 /100 | #53 | Exceptional 85.5% |
| Albanians | 99.7 /100 | #54 | Exceptional 85.5% |
| Immigrants | Brazil | 99.7 /100 | #55 | Exceptional 85.5% |
| Eastern Europeans | 99.6 /100 | #56 | Exceptional 85.5% |
| Estonians | 99.6 /100 | #57 | Exceptional 85.5% |