Alaskan Athabascan vs Immigrants from Cabo Verde Disability
COMPARE
Alaskan Athabascan
Immigrants from Cabo Verde
Disability
Disability Comparison
Alaskan Athabascans
Immigrants from Cabo Verde
14.4%
DISABILITY
0.0/ 100
METRIC RATING
331st/ 347
METRIC RANK
13.7%
DISABILITY
0.0/ 100
METRIC RATING
317th/ 347
METRIC RANK
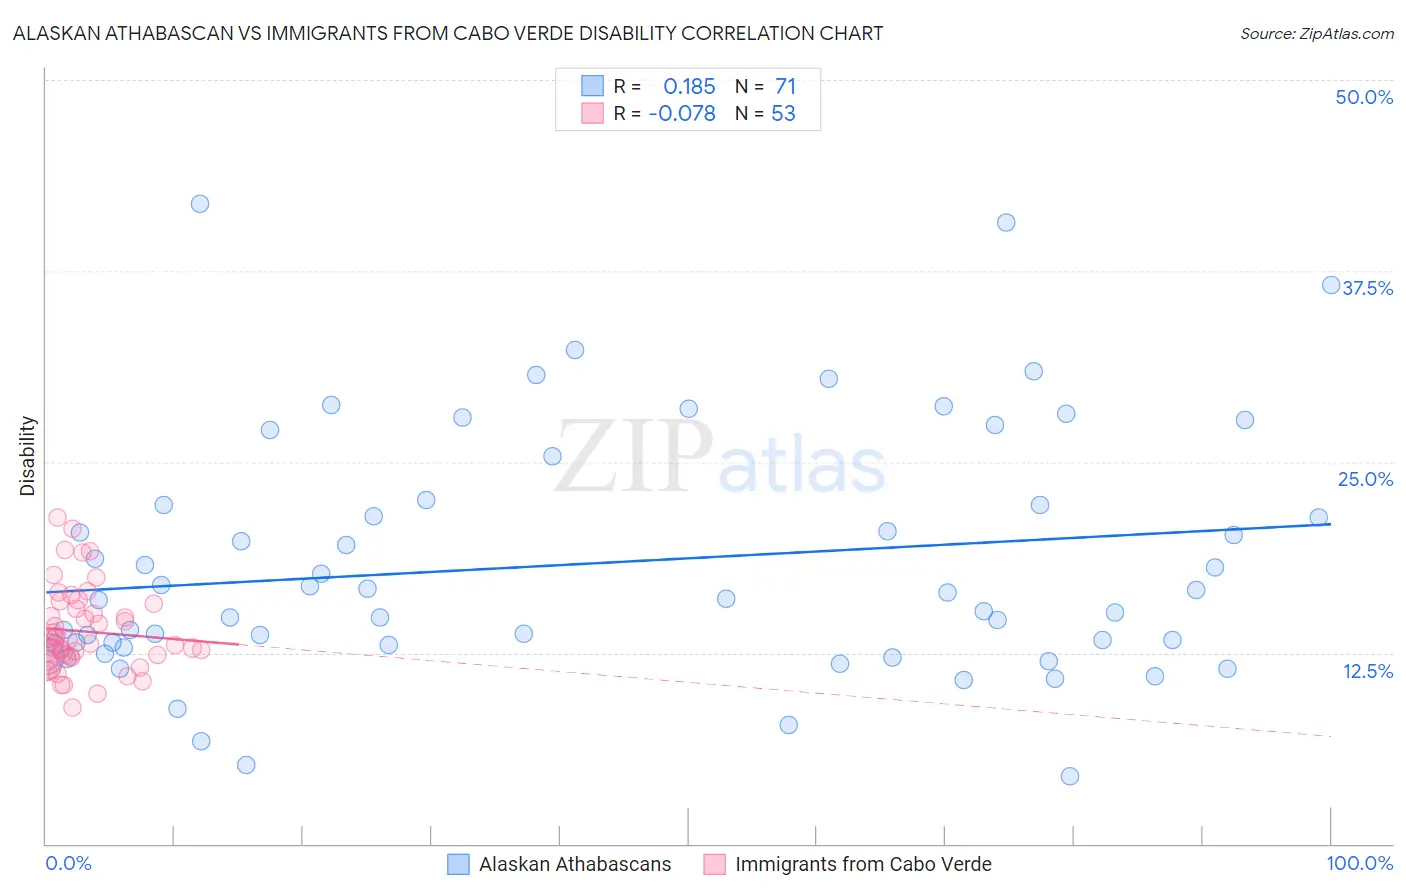
Alaskan Athabascan vs Immigrants from Cabo Verde Disability Correlation Chart
The statistical analysis conducted on geographies consisting of 45,821,092 people shows a poor positive correlation between the proportion of Alaskan Athabascans and percentage of population with a disability in the United States with a correlation coefficient (R) of 0.185 and weighted average of 14.4%. Similarly, the statistical analysis conducted on geographies consisting of 38,149,836 people shows a slight negative correlation between the proportion of Immigrants from Cabo Verde and percentage of population with a disability in the United States with a correlation coefficient (R) of -0.078 and weighted average of 13.7%, a difference of 5.4%.
Disability Correlation Summary
| Measurement | Alaskan Athabascan | Immigrants from Cabo Verde |
| Minimum | 4.4% | 8.9% |
| Maximum | 41.9% | 21.3% |
| Range | 37.5% | 12.4% |
| Mean | 18.3% | 13.9% |
| Median | 16.0% | 13.1% |
| Interquartile 25% (IQ1) | 13.0% | 12.2% |
| Interquartile 75% (IQ3) | 22.2% | 15.5% |
| Interquartile Range (IQR) | 9.2% | 3.3% |
| Standard Deviation (Sample) | 8.0% | 2.7% |
| Standard Deviation (Population) | 8.0% | 2.7% |
Demographics Similar to Alaskan Athabascans and Immigrants from Cabo Verde by Disability
In terms of disability, the demographic groups most similar to Alaskan Athabascans are Pueblo (14.4%, a difference of 0.020%), Cajun (14.6%, a difference of 1.1%), Yuman (14.6%, a difference of 1.2%), Navajo (14.3%, a difference of 1.3%), and Potawatomi (14.2%, a difference of 1.9%). Similarly, the demographic groups most similar to Immigrants from Cabo Verde are Pima (13.7%, a difference of 0.0%), Black/African American (13.7%, a difference of 0.030%), Puget Sound Salish (13.7%, a difference of 0.030%), Menominee (13.8%, a difference of 0.58%), and Iroquois (13.8%, a difference of 0.79%).
| Demographics | Rating | Rank | Disability |
| Blacks/African Americans | 0.0 /100 | #314 | Tragic 13.7% |
| Puget Sound Salish | 0.0 /100 | #315 | Tragic 13.7% |
| Pima | 0.0 /100 | #316 | Tragic 13.7% |
| Immigrants | Cabo Verde | 0.0 /100 | #317 | Tragic 13.7% |
| Menominee | 0.0 /100 | #318 | Tragic 13.8% |
| Iroquois | 0.0 /100 | #319 | Tragic 13.8% |
| Apache | 0.0 /100 | #320 | Tragic 13.9% |
| Paiute | 0.0 /100 | #321 | Tragic 13.9% |
| Americans | 0.0 /100 | #322 | Tragic 13.9% |
| Comanche | 0.0 /100 | #323 | Tragic 14.1% |
| Chippewa | 0.0 /100 | #324 | Tragic 14.1% |
| Natives/Alaskans | 0.0 /100 | #325 | Tragic 14.2% |
| Osage | 0.0 /100 | #326 | Tragic 14.2% |
| Ottawa | 0.0 /100 | #327 | Tragic 14.2% |
| Immigrants | Azores | 0.0 /100 | #328 | Tragic 14.2% |
| Potawatomi | 0.0 /100 | #329 | Tragic 14.2% |
| Navajo | 0.0 /100 | #330 | Tragic 14.3% |
| Alaskan Athabascans | 0.0 /100 | #331 | Tragic 14.4% |
| Pueblo | 0.0 /100 | #332 | Tragic 14.4% |
| Cajuns | 0.0 /100 | #333 | Tragic 14.6% |
| Yuman | 0.0 /100 | #334 | Tragic 14.6% |