Alaska Native vs Nonimmigrants Child Poverty Under the Age of 16
COMPARE
Alaska Native
Nonimmigrants
Child Poverty Under the Age of 16
Child Poverty Under the Age of 16 Comparison
Alaska Natives
Nonimmigrants
17.2%
CHILD POVERTY UNDER THE AGE OF 16
11.8/ 100
METRIC RATING
206th/ 347
METRIC RANK
17.9%
CHILD POVERTY UNDER THE AGE OF 16
2.7/ 100
METRIC RATING
225th/ 347
METRIC RANK
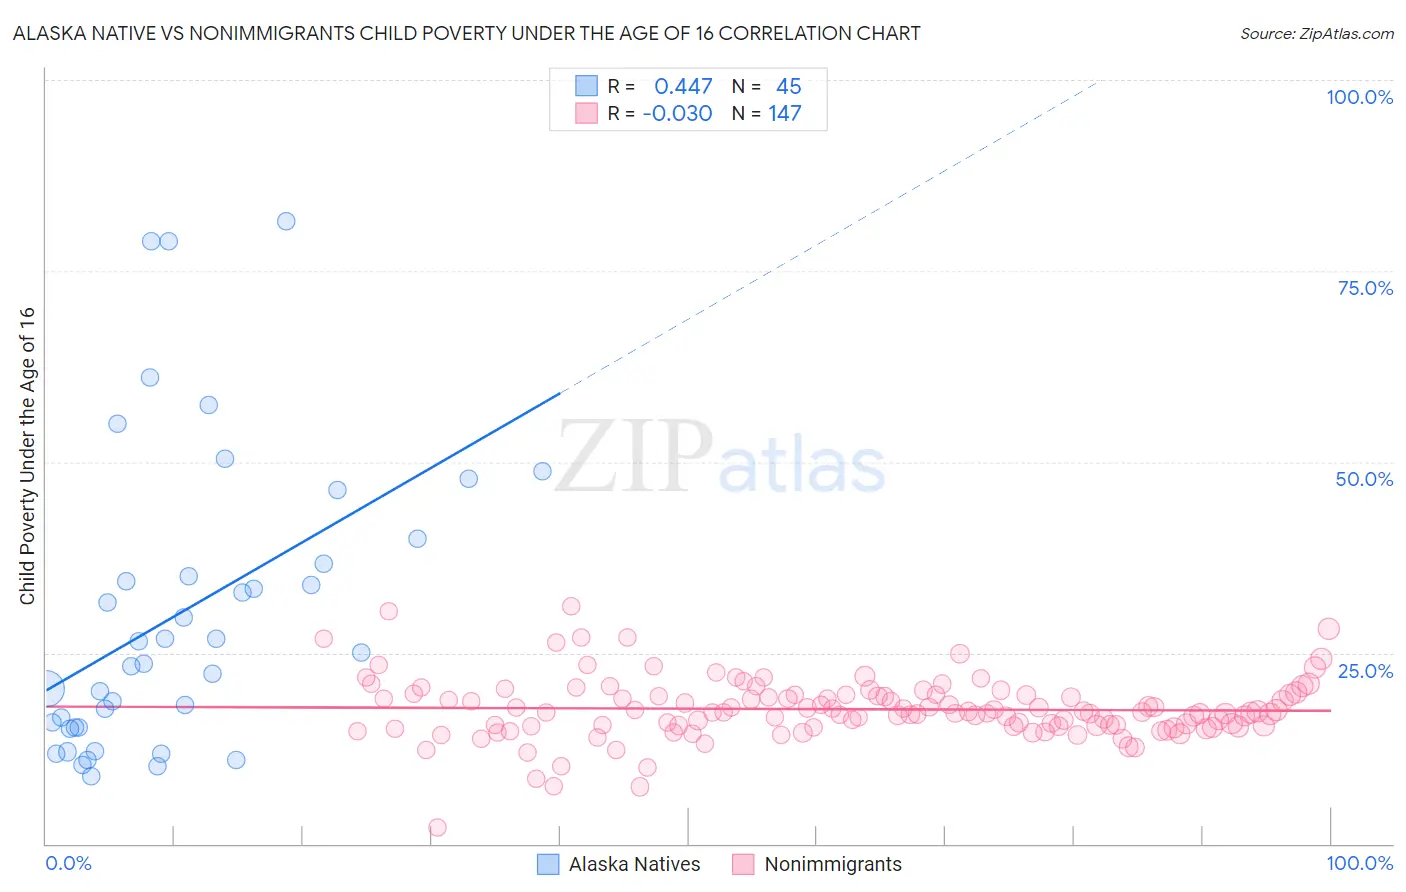
Alaska Native vs Nonimmigrants Child Poverty Under the Age of 16 Correlation Chart
The statistical analysis conducted on geographies consisting of 76,612,165 people shows a moderate positive correlation between the proportion of Alaska Natives and poverty level among children under the age of 16 in the United States with a correlation coefficient (R) of 0.447 and weighted average of 17.2%. Similarly, the statistical analysis conducted on geographies consisting of 569,879,653 people shows no correlation between the proportion of Nonimmigrants and poverty level among children under the age of 16 in the United States with a correlation coefficient (R) of -0.030 and weighted average of 17.9%, a difference of 4.5%.
Child Poverty Under the Age of 16 Correlation Summary
| Measurement | Alaska Native | Nonimmigrants |
| Minimum | 8.9% | 2.1% |
| Maximum | 81.6% | 31.1% |
| Range | 72.7% | 29.0% |
| Mean | 30.2% | 17.6% |
| Median | 25.0% | 17.2% |
| Interquartile 25% (IQ1) | 15.2% | 15.4% |
| Interquartile 75% (IQ3) | 38.3% | 19.5% |
| Interquartile Range (IQR) | 23.1% | 4.2% |
| Standard Deviation (Sample) | 19.4% | 4.1% |
| Standard Deviation (Population) | 19.1% | 4.0% |
Demographics Similar to Alaska Natives and Nonimmigrants by Child Poverty Under the Age of 16
In terms of child poverty under the age of 16, the demographic groups most similar to Alaska Natives are Aleut (17.1%, a difference of 0.54%), German Russian (17.4%, a difference of 1.0%), Pennsylvania German (17.4%, a difference of 1.4%), Panamanian (17.5%, a difference of 1.7%), and Alaskan Athabascan (17.5%, a difference of 1.7%). Similarly, the demographic groups most similar to Nonimmigrants are Osage (17.9%, a difference of 0.36%), Immigrants from Cambodia (17.8%, a difference of 0.60%), Immigrants from Armenia (17.8%, a difference of 0.84%), Cuban (17.8%, a difference of 0.90%), and Immigrants from Panama (17.7%, a difference of 1.2%).
| Demographics | Rating | Rank | Child Poverty Under the Age of 16 |
| Aleuts | 13.9 /100 | #205 | Poor 17.1% |
| Alaska Natives | 11.8 /100 | #206 | Poor 17.2% |
| German Russians | 8.6 /100 | #207 | Tragic 17.4% |
| Pennsylvania Germans | 7.5 /100 | #208 | Tragic 17.4% |
| Panamanians | 6.9 /100 | #209 | Tragic 17.5% |
| Alaskan Athabascans | 6.9 /100 | #210 | Tragic 17.5% |
| Immigrants | Thailand | 6.6 /100 | #211 | Tragic 17.5% |
| Immigrants | Immigrants | 6.5 /100 | #212 | Tragic 17.5% |
| Immigrants | Azores | 6.2 /100 | #213 | Tragic 17.5% |
| Iraqis | 5.9 /100 | #214 | Tragic 17.5% |
| Malaysians | 5.9 /100 | #215 | Tragic 17.5% |
| Sierra Leoneans | 5.7 /100 | #216 | Tragic 17.6% |
| Immigrants | Eastern Africa | 5.3 /100 | #217 | Tragic 17.6% |
| Moroccans | 5.3 /100 | #218 | Tragic 17.6% |
| Japanese | 4.7 /100 | #219 | Tragic 17.7% |
| Immigrants | Panama | 4.1 /100 | #220 | Tragic 17.7% |
| Cubans | 3.7 /100 | #221 | Tragic 17.8% |
| Immigrants | Armenia | 3.6 /100 | #222 | Tragic 17.8% |
| Immigrants | Cambodia | 3.3 /100 | #223 | Tragic 17.8% |
| Osage | 3.1 /100 | #224 | Tragic 17.9% |
| Immigrants | Nonimmigrants | 2.7 /100 | #225 | Tragic 17.9% |