Alaska Native vs Immigrants from El Salvador In Labor Force | Age 30-34
COMPARE
Alaska Native
Immigrants from El Salvador
In Labor Force | Age 30-34
In Labor Force | Age 30-34 Comparison
Alaska Natives
Immigrants from El Salvador
81.3%
IN LABOR FORCE | AGE 30-34
0.0/ 100
METRIC RATING
321st/ 347
METRIC RANK
84.2%
IN LABOR FORCE | AGE 30-34
3.0/ 100
METRIC RATING
226th/ 347
METRIC RANK
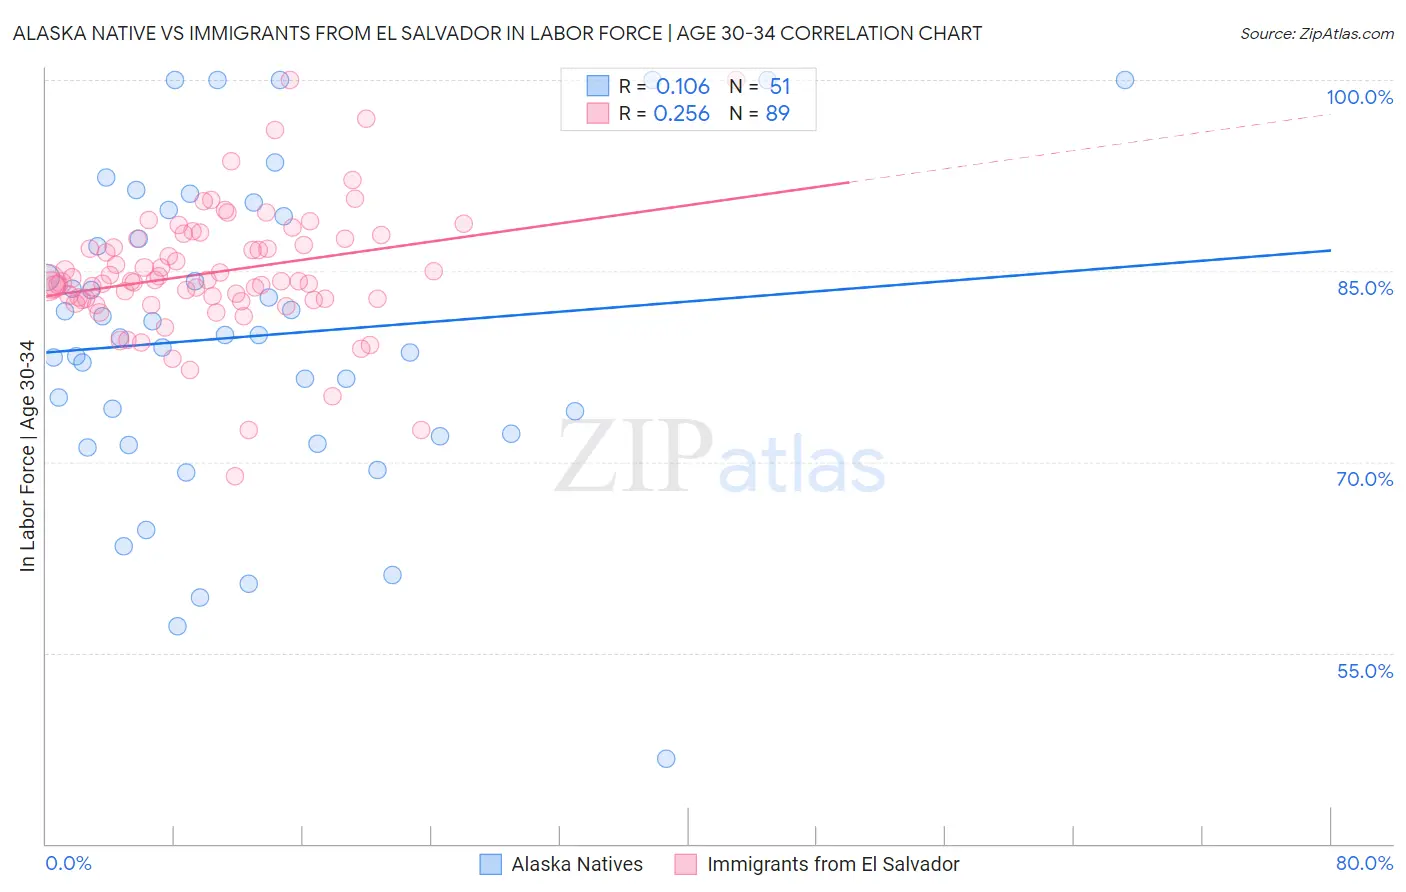
Alaska Native vs Immigrants from El Salvador In Labor Force | Age 30-34 Correlation Chart
The statistical analysis conducted on geographies consisting of 76,755,114 people shows a poor positive correlation between the proportion of Alaska Natives and labor force participation rate among population between the ages 30 and 34 in the United States with a correlation coefficient (R) of 0.106 and weighted average of 81.3%. Similarly, the statistical analysis conducted on geographies consisting of 357,707,534 people shows a weak positive correlation between the proportion of Immigrants from El Salvador and labor force participation rate among population between the ages 30 and 34 in the United States with a correlation coefficient (R) of 0.256 and weighted average of 84.2%, a difference of 3.5%.
In Labor Force | Age 30-34 Correlation Summary
| Measurement | Alaska Native | Immigrants from El Salvador |
| Minimum | 46.7% | 68.9% |
| Maximum | 100.0% | 100.0% |
| Range | 53.3% | 31.1% |
| Mean | 79.9% | 84.9% |
| Median | 80.0% | 84.2% |
| Interquartile 25% (IQ1) | 72.0% | 82.8% |
| Interquartile 75% (IQ3) | 89.3% | 87.5% |
| Interquartile Range (IQR) | 17.3% | 4.8% |
| Standard Deviation (Sample) | 12.2% | 5.0% |
| Standard Deviation (Population) | 12.1% | 5.0% |
Similar Demographics by In Labor Force | Age 30-34
Demographics Similar to Alaska Natives by In Labor Force | Age 30-34
In terms of in labor force | age 30-34, the demographic groups most similar to Alaska Natives are Yaqui (81.4%, a difference of 0.080%), Choctaw (81.4%, a difference of 0.10%), Shoshone (81.4%, a difference of 0.10%), Puerto Rican (81.2%, a difference of 0.16%), and Immigrants from the Azores (81.5%, a difference of 0.18%).
| Demographics | Rating | Rank | In Labor Force | Age 30-34 |
| Alaskan Athabascans | 0.0 /100 | #314 | Tragic 81.7% |
| Cherokee | 0.0 /100 | #315 | Tragic 81.6% |
| Immigrants | Azores | 0.0 /100 | #316 | Tragic 81.5% |
| Arapaho | 0.0 /100 | #317 | Tragic 81.5% |
| Choctaw | 0.0 /100 | #318 | Tragic 81.4% |
| Shoshone | 0.0 /100 | #319 | Tragic 81.4% |
| Yaqui | 0.0 /100 | #320 | Tragic 81.4% |
| Alaska Natives | 0.0 /100 | #321 | Tragic 81.3% |
| Puerto Ricans | 0.0 /100 | #322 | Tragic 81.2% |
| Paiute | 0.0 /100 | #323 | Tragic 81.2% |
| Cheyenne | 0.0 /100 | #324 | Tragic 81.1% |
| Dutch West Indians | 0.0 /100 | #325 | Tragic 81.0% |
| Seminole | 0.0 /100 | #326 | Tragic 80.8% |
| Colville | 0.0 /100 | #327 | Tragic 80.7% |
| Sioux | 0.0 /100 | #328 | Tragic 80.4% |
Demographics Similar to Immigrants from El Salvador by In Labor Force | Age 30-34
In terms of in labor force | age 30-34, the demographic groups most similar to Immigrants from El Salvador are Scottish (84.2%, a difference of 0.0%), Immigrants from Cuba (84.2%, a difference of 0.0%), Immigrants from Haiti (84.2%, a difference of 0.010%), Cuban (84.2%, a difference of 0.020%), and Welsh (84.2%, a difference of 0.020%).
| Demographics | Rating | Rank | In Labor Force | Age 30-34 |
| Swiss | 5.8 /100 | #219 | Tragic 84.3% |
| Danes | 5.3 /100 | #220 | Tragic 84.3% |
| Salvadorans | 3.8 /100 | #221 | Tragic 84.2% |
| Panamanians | 3.8 /100 | #222 | Tragic 84.2% |
| Immigrants | Laos | 3.6 /100 | #223 | Tragic 84.2% |
| Cubans | 3.4 /100 | #224 | Tragic 84.2% |
| Scottish | 3.1 /100 | #225 | Tragic 84.2% |
| Immigrants | El Salvador | 3.0 /100 | #226 | Tragic 84.2% |
| Immigrants | Cuba | 3.0 /100 | #227 | Tragic 84.2% |
| Immigrants | Haiti | 2.8 /100 | #228 | Tragic 84.2% |
| Welsh | 2.7 /100 | #229 | Tragic 84.2% |
| Immigrants | Bahamas | 2.6 /100 | #230 | Tragic 84.1% |
| Malaysians | 2.2 /100 | #231 | Tragic 84.1% |
| Immigrants | Immigrants | 2.0 /100 | #232 | Tragic 84.1% |
| West Indians | 1.9 /100 | #233 | Tragic 84.1% |