White/Caucasian vs Immigrants from South Eastern Asia In Labor Force | Age 20-64
COMPARE
White/Caucasian
Immigrants from South Eastern Asia
In Labor Force | Age 20-64
In Labor Force | Age 20-64 Comparison
Whites/Caucasians
Immigrants from South Eastern Asia
78.5%
IN LABOR FORCE | AGE 20-64
0.2/ 100
METRIC RATING
261st/ 347
METRIC RANK
79.8%
IN LABOR FORCE | AGE 20-64
80.4/ 100
METRIC RATING
140th/ 347
METRIC RANK
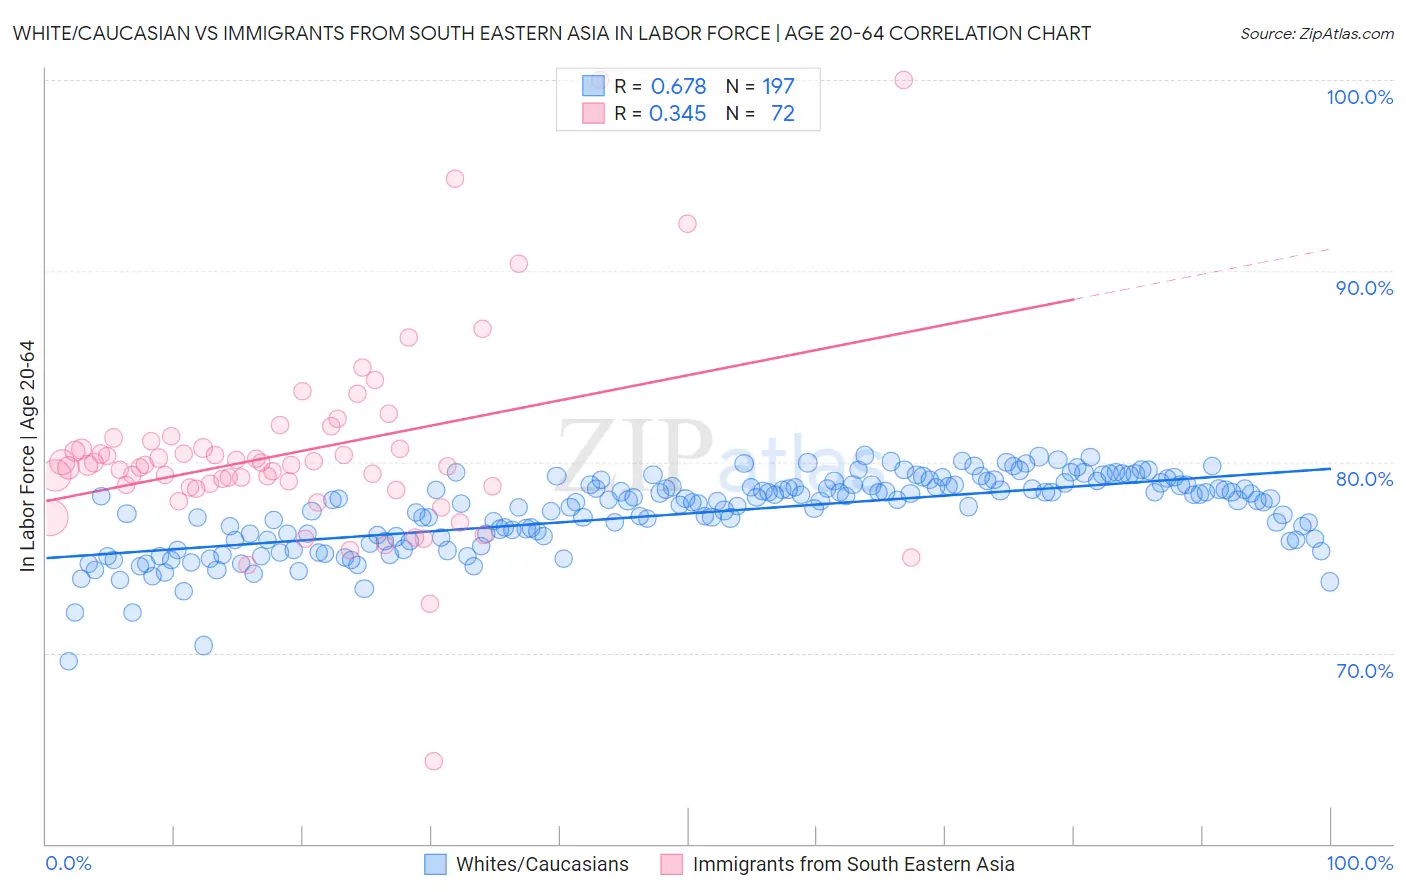
White/Caucasian vs Immigrants from South Eastern Asia In Labor Force | Age 20-64 Correlation Chart
The statistical analysis conducted on geographies consisting of 584,882,256 people shows a significant positive correlation between the proportion of Whites/Caucasians and labor force participation rate among population between the ages 20 and 64 in the United States with a correlation coefficient (R) of 0.678 and weighted average of 78.5%. Similarly, the statistical analysis conducted on geographies consisting of 512,697,345 people shows a mild positive correlation between the proportion of Immigrants from South Eastern Asia and labor force participation rate among population between the ages 20 and 64 in the United States with a correlation coefficient (R) of 0.345 and weighted average of 79.8%, a difference of 1.6%.
In Labor Force | Age 20-64 Correlation Summary
| Measurement | White/Caucasian | Immigrants from South Eastern Asia |
| Minimum | 69.6% | 64.3% |
| Maximum | 80.3% | 100.0% |
| Range | 10.8% | 35.7% |
| Mean | 77.3% | 80.5% |
| Median | 77.9% | 79.8% |
| Interquartile 25% (IQ1) | 75.9% | 78.7% |
| Interquartile 75% (IQ3) | 78.8% | 80.9% |
| Interquartile Range (IQR) | 2.8% | 2.2% |
| Standard Deviation (Sample) | 2.0% | 5.3% |
| Standard Deviation (Population) | 2.0% | 5.2% |
Similar Demographics by In Labor Force | Age 20-64
Demographics Similar to Whites/Caucasians by In Labor Force | Age 20-64
In terms of in labor force | age 20-64, the demographic groups most similar to Whites/Caucasians are Immigrants from Fiji (78.6%, a difference of 0.11%), Fijian (78.4%, a difference of 0.13%), Pennsylvania German (78.4%, a difference of 0.14%), Spaniard (78.4%, a difference of 0.15%), and Tsimshian (78.7%, a difference of 0.18%).
| Demographics | Rating | Rank | In Labor Force | Age 20-64 |
| Immigrants | Lebanon | 0.5 /100 | #254 | Tragic 78.7% |
| Hawaiians | 0.5 /100 | #255 | Tragic 78.7% |
| Celtics | 0.5 /100 | #256 | Tragic 78.7% |
| Guatemalans | 0.4 /100 | #257 | Tragic 78.7% |
| Immigrants | Guatemala | 0.4 /100 | #258 | Tragic 78.7% |
| Tsimshian | 0.4 /100 | #259 | Tragic 78.7% |
| Immigrants | Fiji | 0.3 /100 | #260 | Tragic 78.6% |
| Whites/Caucasians | 0.2 /100 | #261 | Tragic 78.5% |
| Fijians | 0.1 /100 | #262 | Tragic 78.4% |
| Pennsylvania Germans | 0.1 /100 | #263 | Tragic 78.4% |
| Spaniards | 0.1 /100 | #264 | Tragic 78.4% |
| British West Indians | 0.1 /100 | #265 | Tragic 78.4% |
| Bahamians | 0.1 /100 | #266 | Tragic 78.4% |
| U.S. Virgin Islanders | 0.1 /100 | #267 | Tragic 78.4% |
| West Indians | 0.0 /100 | #268 | Tragic 78.3% |
Demographics Similar to Immigrants from South Eastern Asia by In Labor Force | Age 20-64
In terms of in labor force | age 20-64, the demographic groups most similar to Immigrants from South Eastern Asia are Immigrants from Israel (79.8%, a difference of 0.0%), Slovak (79.8%, a difference of 0.010%), Immigrants from Sweden (79.8%, a difference of 0.010%), Korean (79.8%, a difference of 0.010%), and Pakistani (79.8%, a difference of 0.010%).
| Demographics | Rating | Rank | In Labor Force | Age 20-64 |
| South American Indians | 87.6 /100 | #133 | Excellent 79.9% |
| Belgians | 87.4 /100 | #134 | Excellent 79.9% |
| Ukrainians | 86.8 /100 | #135 | Excellent 79.9% |
| Immigrants | Singapore | 86.7 /100 | #136 | Excellent 79.9% |
| Immigrants | Ukraine | 86.5 /100 | #137 | Excellent 79.9% |
| Immigrants | Nigeria | 86.4 /100 | #138 | Excellent 79.9% |
| Immigrants | Spain | 83.9 /100 | #139 | Excellent 79.8% |
| Immigrants | South Eastern Asia | 80.4 /100 | #140 | Excellent 79.8% |
| Immigrants | Israel | 80.0 /100 | #141 | Good 79.8% |
| Slovaks | 79.9 /100 | #142 | Good 79.8% |
| Immigrants | Sweden | 79.7 /100 | #143 | Good 79.8% |
| Koreans | 79.6 /100 | #144 | Good 79.8% |
| Pakistanis | 79.3 /100 | #145 | Good 79.8% |
| Immigrants | Southern Europe | 78.9 /100 | #146 | Good 79.8% |
| Immigrants | Philippines | 78.0 /100 | #147 | Good 79.8% |