Immigrants from Micronesia vs Immigrants from South Eastern Asia In Labor Force | Age 20-64
COMPARE
Immigrants from Micronesia
Immigrants from South Eastern Asia
In Labor Force | Age 20-64
In Labor Force | Age 20-64 Comparison
Immigrants from Micronesia
Immigrants from South Eastern Asia
78.9%
IN LABOR FORCE | AGE 20-64
1.9/ 100
METRIC RATING
242nd/ 347
METRIC RANK
79.8%
IN LABOR FORCE | AGE 20-64
80.4/ 100
METRIC RATING
140th/ 347
METRIC RANK
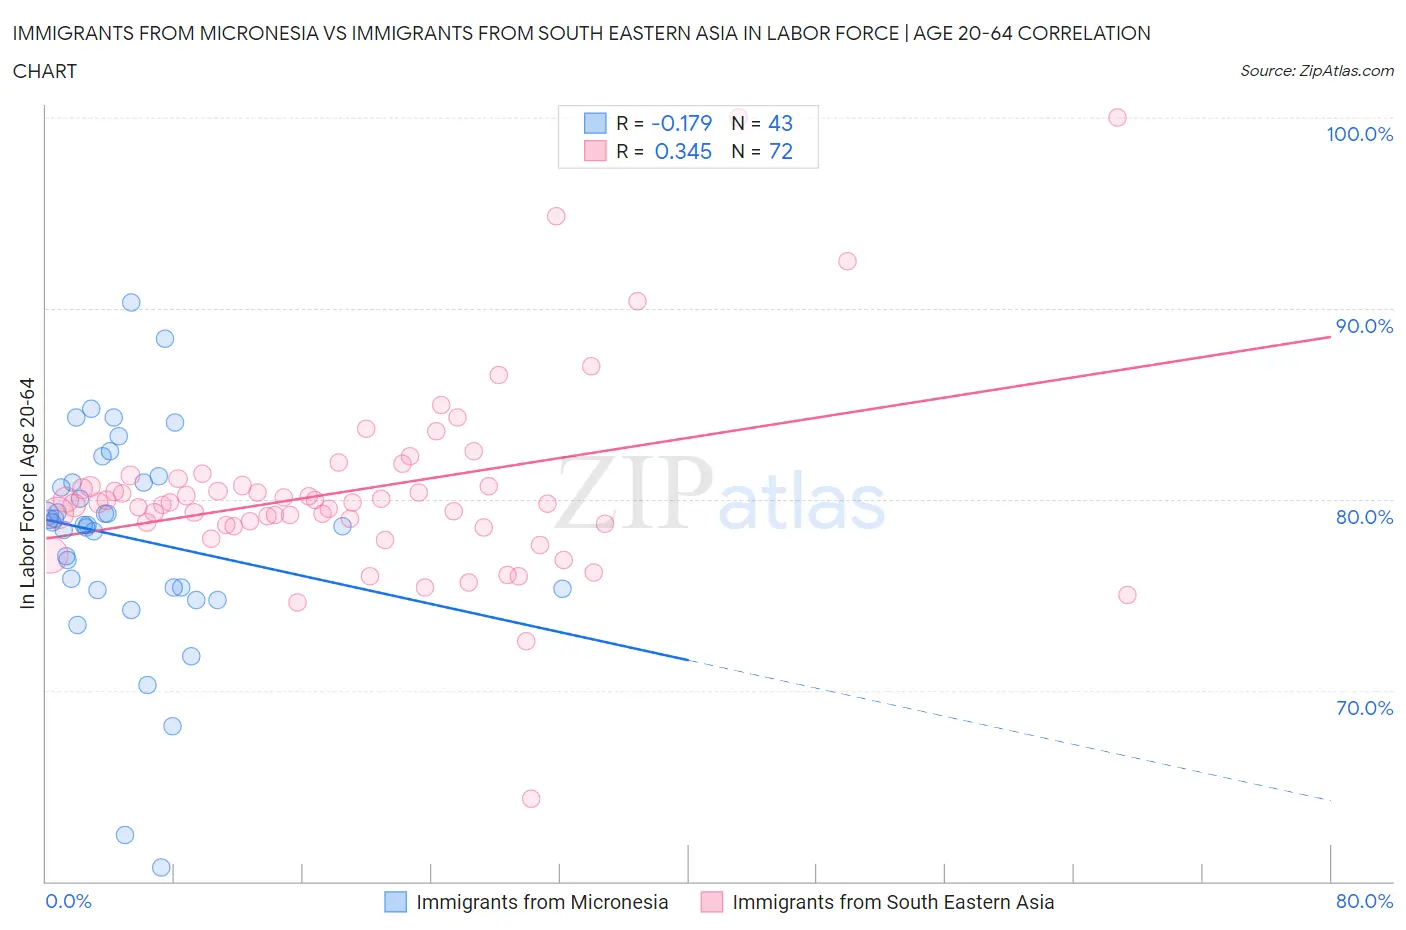
Immigrants from Micronesia vs Immigrants from South Eastern Asia In Labor Force | Age 20-64 Correlation Chart
The statistical analysis conducted on geographies consisting of 61,600,666 people shows a poor negative correlation between the proportion of Immigrants from Micronesia and labor force participation rate among population between the ages 20 and 64 in the United States with a correlation coefficient (R) of -0.179 and weighted average of 78.9%. Similarly, the statistical analysis conducted on geographies consisting of 512,697,345 people shows a mild positive correlation between the proportion of Immigrants from South Eastern Asia and labor force participation rate among population between the ages 20 and 64 in the United States with a correlation coefficient (R) of 0.345 and weighted average of 79.8%, a difference of 1.1%.
In Labor Force | Age 20-64 Correlation Summary
| Measurement | Immigrants from Micronesia | Immigrants from South Eastern Asia |
| Minimum | 60.7% | 64.3% |
| Maximum | 90.3% | 100.0% |
| Range | 29.6% | 35.7% |
| Mean | 78.0% | 80.5% |
| Median | 78.7% | 79.8% |
| Interquartile 25% (IQ1) | 75.3% | 78.7% |
| Interquartile 75% (IQ3) | 80.9% | 80.9% |
| Interquartile Range (IQR) | 5.6% | 2.2% |
| Standard Deviation (Sample) | 5.7% | 5.3% |
| Standard Deviation (Population) | 5.6% | 5.2% |
Similar Demographics by In Labor Force | Age 20-64
Demographics Similar to Immigrants from Micronesia by In Labor Force | Age 20-64
In terms of in labor force | age 20-64, the demographic groups most similar to Immigrants from Micronesia are Jamaican (78.9%, a difference of 0.010%), Immigrants from West Indies (78.9%, a difference of 0.020%), Welsh (79.0%, a difference of 0.040%), Trinidadian and Tobagonian (79.0%, a difference of 0.040%), and French (78.9%, a difference of 0.050%).
| Demographics | Rating | Rank | In Labor Force | Age 20-64 |
| Tlingit-Haida | 3.2 /100 | #235 | Tragic 79.0% |
| Samoans | 2.9 /100 | #236 | Tragic 79.0% |
| Immigrants | North America | 2.9 /100 | #237 | Tragic 79.0% |
| Immigrants | Jamaica | 2.6 /100 | #238 | Tragic 79.0% |
| Welsh | 2.4 /100 | #239 | Tragic 79.0% |
| Trinidadians and Tobagonians | 2.3 /100 | #240 | Tragic 79.0% |
| Jamaicans | 2.0 /100 | #241 | Tragic 78.9% |
| Immigrants | Micronesia | 1.9 /100 | #242 | Tragic 78.9% |
| Immigrants | West Indies | 1.7 /100 | #243 | Tragic 78.9% |
| French | 1.5 /100 | #244 | Tragic 78.9% |
| Scottish | 1.3 /100 | #245 | Tragic 78.9% |
| Immigrants | Trinidad and Tobago | 1.1 /100 | #246 | Tragic 78.8% |
| Immigrants | Germany | 1.0 /100 | #247 | Tragic 78.8% |
| Immigrants | Caribbean | 1.0 /100 | #248 | Tragic 78.8% |
| English | 0.9 /100 | #249 | Tragic 78.8% |
Demographics Similar to Immigrants from South Eastern Asia by In Labor Force | Age 20-64
In terms of in labor force | age 20-64, the demographic groups most similar to Immigrants from South Eastern Asia are Immigrants from Israel (79.8%, a difference of 0.0%), Slovak (79.8%, a difference of 0.010%), Immigrants from Sweden (79.8%, a difference of 0.010%), Korean (79.8%, a difference of 0.010%), and Pakistani (79.8%, a difference of 0.010%).
| Demographics | Rating | Rank | In Labor Force | Age 20-64 |
| South American Indians | 87.6 /100 | #133 | Excellent 79.9% |
| Belgians | 87.4 /100 | #134 | Excellent 79.9% |
| Ukrainians | 86.8 /100 | #135 | Excellent 79.9% |
| Immigrants | Singapore | 86.7 /100 | #136 | Excellent 79.9% |
| Immigrants | Ukraine | 86.5 /100 | #137 | Excellent 79.9% |
| Immigrants | Nigeria | 86.4 /100 | #138 | Excellent 79.9% |
| Immigrants | Spain | 83.9 /100 | #139 | Excellent 79.8% |
| Immigrants | South Eastern Asia | 80.4 /100 | #140 | Excellent 79.8% |
| Immigrants | Israel | 80.0 /100 | #141 | Good 79.8% |
| Slovaks | 79.9 /100 | #142 | Good 79.8% |
| Immigrants | Sweden | 79.7 /100 | #143 | Good 79.8% |
| Koreans | 79.6 /100 | #144 | Good 79.8% |
| Pakistanis | 79.3 /100 | #145 | Good 79.8% |
| Immigrants | Southern Europe | 78.9 /100 | #146 | Good 79.8% |
| Immigrants | Philippines | 78.0 /100 | #147 | Good 79.8% |