Immigrants from Pakistan vs Immigrants from South Eastern Asia In Labor Force | Age 20-64
COMPARE
Immigrants from Pakistan
Immigrants from South Eastern Asia
In Labor Force | Age 20-64
In Labor Force | Age 20-64 Comparison
Immigrants from Pakistan
Immigrants from South Eastern Asia
80.5%
IN LABOR FORCE | AGE 20-64
99.6/ 100
METRIC RATING
46th/ 347
METRIC RANK
79.8%
IN LABOR FORCE | AGE 20-64
80.4/ 100
METRIC RATING
140th/ 347
METRIC RANK
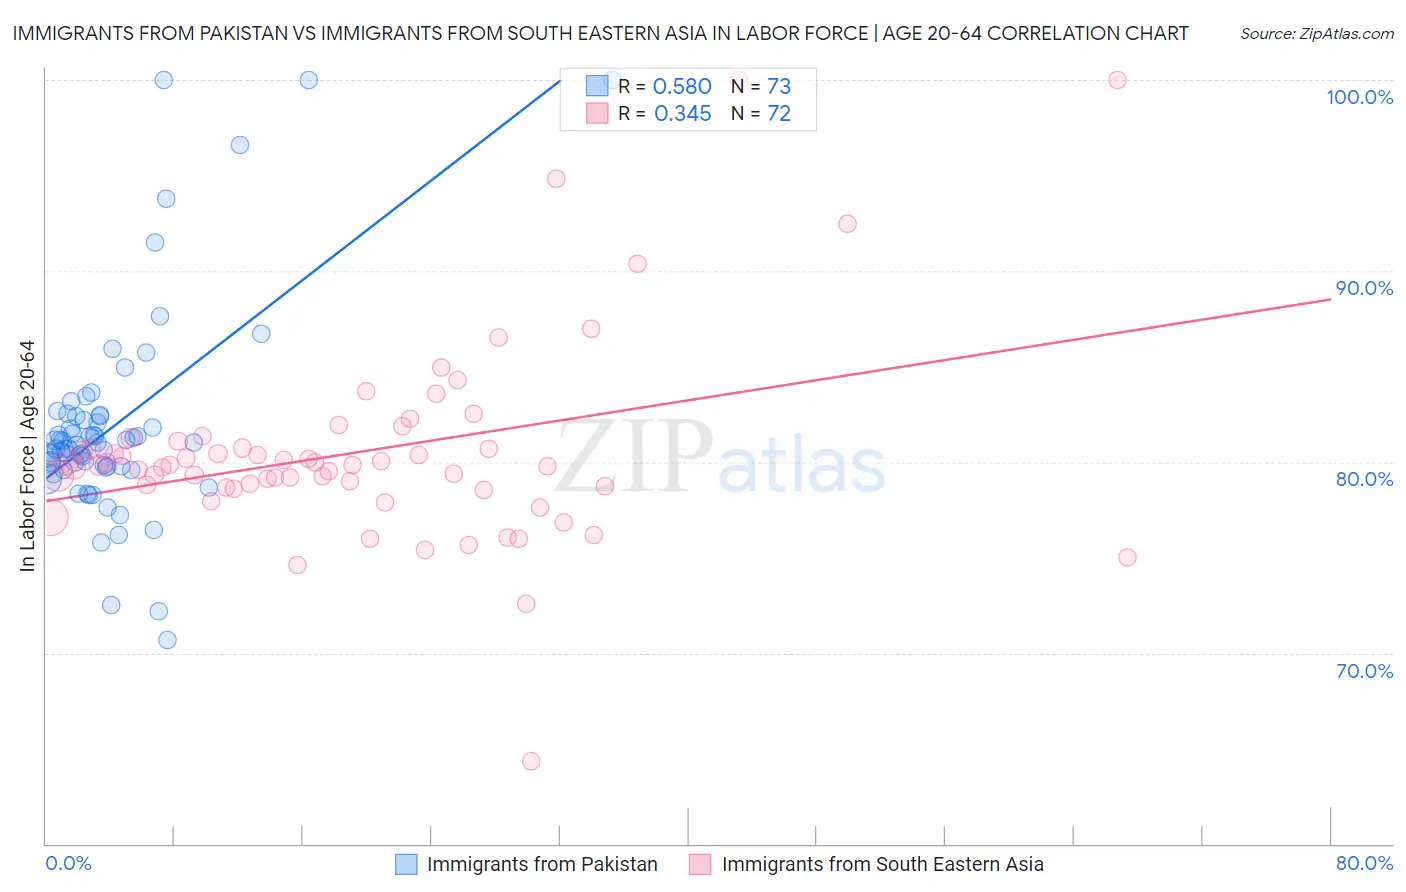
Immigrants from Pakistan vs Immigrants from South Eastern Asia In Labor Force | Age 20-64 Correlation Chart
The statistical analysis conducted on geographies consisting of 283,910,968 people shows a substantial positive correlation between the proportion of Immigrants from Pakistan and labor force participation rate among population between the ages 20 and 64 in the United States with a correlation coefficient (R) of 0.580 and weighted average of 80.5%. Similarly, the statistical analysis conducted on geographies consisting of 512,697,345 people shows a mild positive correlation between the proportion of Immigrants from South Eastern Asia and labor force participation rate among population between the ages 20 and 64 in the United States with a correlation coefficient (R) of 0.345 and weighted average of 79.8%, a difference of 0.85%.
In Labor Force | Age 20-64 Correlation Summary
| Measurement | Immigrants from Pakistan | Immigrants from South Eastern Asia |
| Minimum | 70.7% | 64.3% |
| Maximum | 100.0% | 100.0% |
| Range | 29.3% | 35.7% |
| Mean | 81.8% | 80.5% |
| Median | 80.9% | 79.8% |
| Interquartile 25% (IQ1) | 79.7% | 78.7% |
| Interquartile 75% (IQ3) | 82.4% | 80.9% |
| Interquartile Range (IQR) | 2.7% | 2.2% |
| Standard Deviation (Sample) | 5.4% | 5.3% |
| Standard Deviation (Population) | 5.4% | 5.2% |
Similar Demographics by In Labor Force | Age 20-64
Demographics Similar to Immigrants from Pakistan by In Labor Force | Age 20-64
In terms of in labor force | age 20-64, the demographic groups most similar to Immigrants from Pakistan are Slovene (80.5%, a difference of 0.010%), Immigrants from Middle Africa (80.5%, a difference of 0.030%), Immigrants from Africa (80.4%, a difference of 0.040%), Immigrants from Hong Kong (80.4%, a difference of 0.060%), and Latvian (80.5%, a difference of 0.070%).
| Demographics | Rating | Rank | In Labor Force | Age 20-64 |
| Brazilians | 99.8 /100 | #39 | Exceptional 80.5% |
| Immigrants | Zimbabwe | 99.8 /100 | #40 | Exceptional 80.5% |
| Immigrants | Liberia | 99.8 /100 | #41 | Exceptional 80.5% |
| Latvians | 99.8 /100 | #42 | Exceptional 80.5% |
| Czechs | 99.7 /100 | #43 | Exceptional 80.5% |
| Immigrants | Middle Africa | 99.7 /100 | #44 | Exceptional 80.5% |
| Slovenes | 99.7 /100 | #45 | Exceptional 80.5% |
| Immigrants | Pakistan | 99.6 /100 | #46 | Exceptional 80.5% |
| Immigrants | Africa | 99.6 /100 | #47 | Exceptional 80.4% |
| Immigrants | Hong Kong | 99.5 /100 | #48 | Exceptional 80.4% |
| Immigrants | Greece | 99.4 /100 | #49 | Exceptional 80.4% |
| Immigrants | Sudan | 99.4 /100 | #50 | Exceptional 80.4% |
| Immigrants | Sri Lanka | 99.3 /100 | #51 | Exceptional 80.4% |
| Turks | 99.2 /100 | #52 | Exceptional 80.3% |
| Immigrants | Peru | 99.2 /100 | #53 | Exceptional 80.3% |
Demographics Similar to Immigrants from South Eastern Asia by In Labor Force | Age 20-64
In terms of in labor force | age 20-64, the demographic groups most similar to Immigrants from South Eastern Asia are Immigrants from Israel (79.8%, a difference of 0.0%), Slovak (79.8%, a difference of 0.010%), Immigrants from Sweden (79.8%, a difference of 0.010%), Korean (79.8%, a difference of 0.010%), and Pakistani (79.8%, a difference of 0.010%).
| Demographics | Rating | Rank | In Labor Force | Age 20-64 |
| South American Indians | 87.6 /100 | #133 | Excellent 79.9% |
| Belgians | 87.4 /100 | #134 | Excellent 79.9% |
| Ukrainians | 86.8 /100 | #135 | Excellent 79.9% |
| Immigrants | Singapore | 86.7 /100 | #136 | Excellent 79.9% |
| Immigrants | Ukraine | 86.5 /100 | #137 | Excellent 79.9% |
| Immigrants | Nigeria | 86.4 /100 | #138 | Excellent 79.9% |
| Immigrants | Spain | 83.9 /100 | #139 | Excellent 79.8% |
| Immigrants | South Eastern Asia | 80.4 /100 | #140 | Excellent 79.8% |
| Immigrants | Israel | 80.0 /100 | #141 | Good 79.8% |
| Slovaks | 79.9 /100 | #142 | Good 79.8% |
| Immigrants | Sweden | 79.7 /100 | #143 | Good 79.8% |
| Koreans | 79.6 /100 | #144 | Good 79.8% |
| Pakistanis | 79.3 /100 | #145 | Good 79.8% |
| Immigrants | Southern Europe | 78.9 /100 | #146 | Good 79.8% |
| Immigrants | Philippines | 78.0 /100 | #147 | Good 79.8% |