Afghan vs Sri Lankan In Labor Force | Age 30-34
COMPARE
Afghan
Sri Lankan
In Labor Force | Age 30-34
In Labor Force | Age 30-34 Comparison
Afghans
Sri Lankans
84.7%
IN LABOR FORCE | AGE 30-34
55.2/ 100
METRIC RATING
166th/ 347
METRIC RANK
85.0%
IN LABOR FORCE | AGE 30-34
87.8/ 100
METRIC RATING
138th/ 347
METRIC RANK
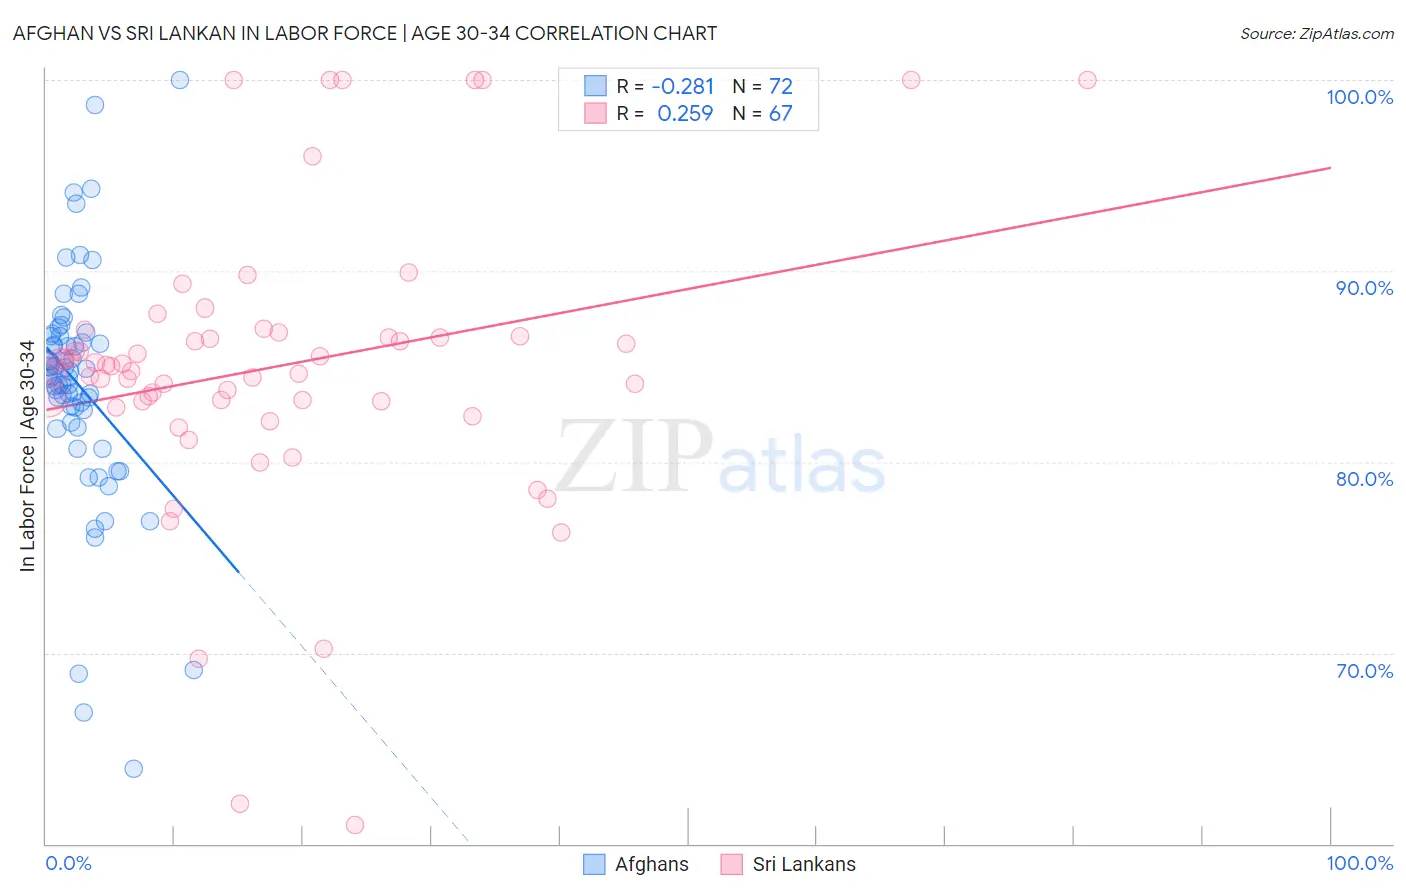
Afghan vs Sri Lankan In Labor Force | Age 30-34 Correlation Chart
The statistical analysis conducted on geographies consisting of 148,857,099 people shows a weak negative correlation between the proportion of Afghans and labor force participation rate among population between the ages 30 and 34 in the United States with a correlation coefficient (R) of -0.281 and weighted average of 84.7%. Similarly, the statistical analysis conducted on geographies consisting of 440,177,214 people shows a weak positive correlation between the proportion of Sri Lankans and labor force participation rate among population between the ages 30 and 34 in the United States with a correlation coefficient (R) of 0.259 and weighted average of 85.0%, a difference of 0.31%.
In Labor Force | Age 30-34 Correlation Summary
| Measurement | Afghan | Sri Lankan |
| Minimum | 63.9% | 61.0% |
| Maximum | 100.0% | 100.0% |
| Range | 36.1% | 39.0% |
| Mean | 84.1% | 85.0% |
| Median | 84.5% | 85.0% |
| Interquartile 25% (IQ1) | 82.4% | 83.2% |
| Interquartile 75% (IQ3) | 86.6% | 86.6% |
| Interquartile Range (IQR) | 4.2% | 3.4% |
| Standard Deviation (Sample) | 6.1% | 7.6% |
| Standard Deviation (Population) | 6.0% | 7.5% |
Similar Demographics by In Labor Force | Age 30-34
Demographics Similar to Afghans by In Labor Force | Age 30-34
In terms of in labor force | age 30-34, the demographic groups most similar to Afghans are Icelander (84.7%, a difference of 0.010%), Immigrants from Western Europe (84.7%, a difference of 0.010%), Immigrants from South Eastern Asia (84.7%, a difference of 0.010%), South American (84.7%, a difference of 0.020%), and Immigrants from Uruguay (84.7%, a difference of 0.020%).
| Demographics | Rating | Rank | In Labor Force | Age 30-34 |
| Czechoslovakians | 63.0 /100 | #159 | Good 84.8% |
| Pakistanis | 60.8 /100 | #160 | Good 84.7% |
| Immigrants | Cambodia | 60.7 /100 | #161 | Good 84.7% |
| South Americans | 58.7 /100 | #162 | Average 84.7% |
| Immigrants | Uruguay | 57.4 /100 | #163 | Average 84.7% |
| Icelanders | 56.8 /100 | #164 | Average 84.7% |
| Immigrants | Western Europe | 56.7 /100 | #165 | Average 84.7% |
| Afghans | 55.2 /100 | #166 | Average 84.7% |
| Immigrants | South Eastern Asia | 54.2 /100 | #167 | Average 84.7% |
| Immigrants | Peru | 52.4 /100 | #168 | Average 84.7% |
| South American Indians | 52.1 /100 | #169 | Average 84.7% |
| Immigrants | Burma/Myanmar | 52.0 /100 | #170 | Average 84.7% |
| Irish | 52.0 /100 | #171 | Average 84.7% |
| Immigrants | England | 51.7 /100 | #172 | Average 84.7% |
| Israelis | 51.1 /100 | #173 | Average 84.7% |
Demographics Similar to Sri Lankans by In Labor Force | Age 30-34
In terms of in labor force | age 30-34, the demographic groups most similar to Sri Lankans are South African (85.0%, a difference of 0.0%), Jordanian (85.0%, a difference of 0.010%), Bhutanese (85.0%, a difference of 0.010%), Immigrants from Chile (85.0%, a difference of 0.020%), and Immigrants from Asia (85.0%, a difference of 0.020%).
| Demographics | Rating | Rank | In Labor Force | Age 30-34 |
| Chinese | 89.6 /100 | #131 | Excellent 85.0% |
| Immigrants | Israel | 89.5 /100 | #132 | Excellent 85.0% |
| New Zealanders | 89.5 /100 | #133 | Excellent 85.0% |
| Immigrants | Chile | 89.2 /100 | #134 | Excellent 85.0% |
| Immigrants | Asia | 88.9 /100 | #135 | Excellent 85.0% |
| Jordanians | 88.6 /100 | #136 | Excellent 85.0% |
| South Africans | 88.0 /100 | #137 | Excellent 85.0% |
| Sri Lankans | 87.8 /100 | #138 | Excellent 85.0% |
| Bhutanese | 87.5 /100 | #139 | Excellent 85.0% |
| Immigrants | Vietnam | 86.5 /100 | #140 | Excellent 85.0% |
| Chileans | 85.3 /100 | #141 | Excellent 84.9% |
| Immigrants | Indonesia | 84.3 /100 | #142 | Excellent 84.9% |
| Colombians | 82.2 /100 | #143 | Excellent 84.9% |
| Uruguayans | 78.5 /100 | #144 | Good 84.9% |
| Palestinians | 77.7 /100 | #145 | Good 84.9% |