Estonian vs Immigrants In Labor Force | Age 20-24
COMPARE
Estonian
Immigrants
In Labor Force | Age 20-24
In Labor Force | Age 20-24 Comparison
Estonians
Immigrants
75.6%
IN LABOR FORCE | AGE 20-24
87.1/ 100
METRIC RATING
134th/ 347
METRIC RANK
74.1%
IN LABOR FORCE | AGE 20-24
3.6/ 100
METRIC RATING
234th/ 347
METRIC RANK
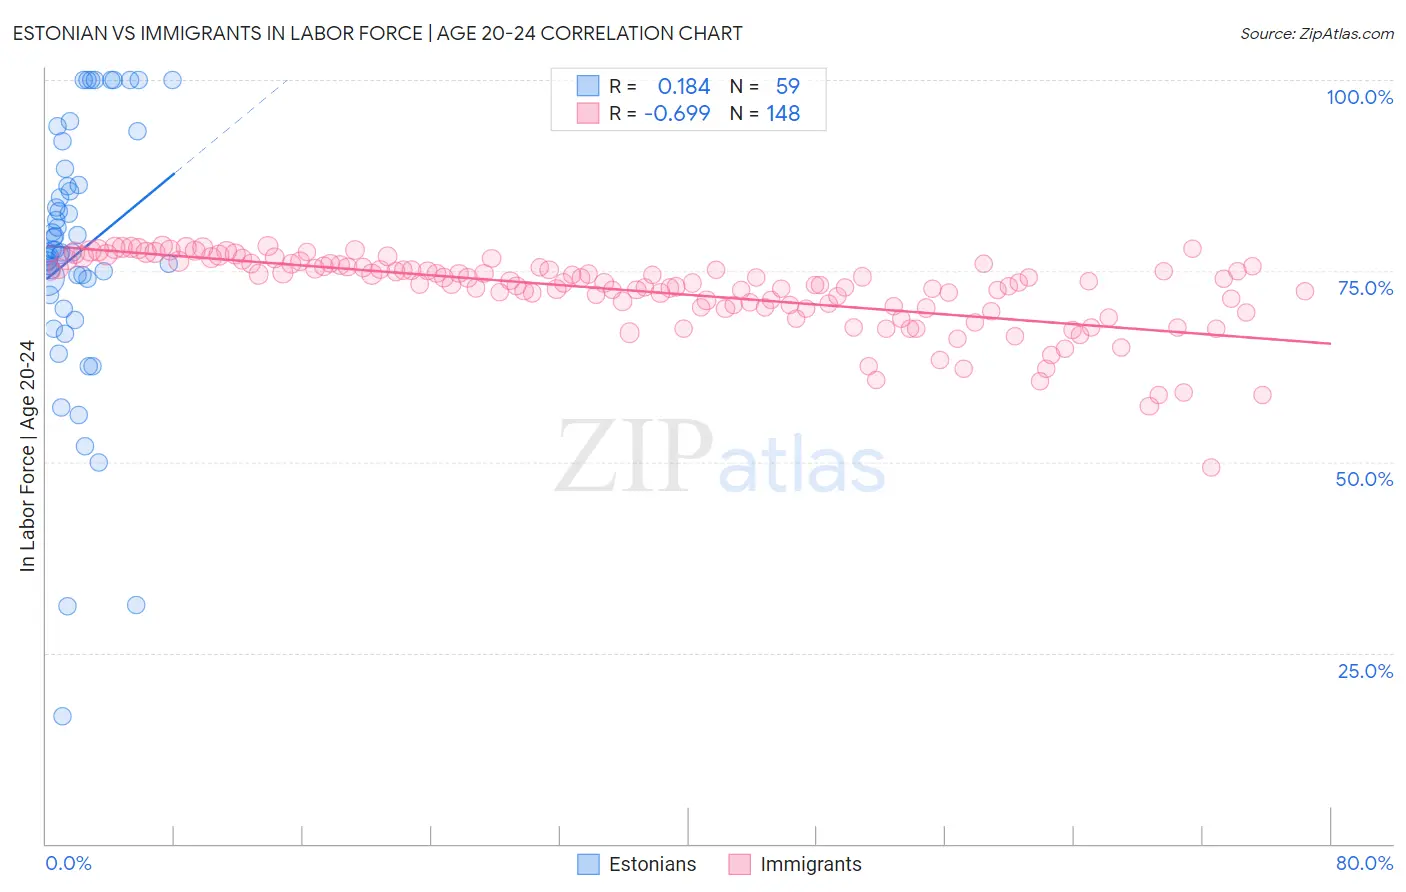
Estonian vs Immigrants In Labor Force | Age 20-24 Correlation Chart
The statistical analysis conducted on geographies consisting of 123,512,369 people shows a poor positive correlation between the proportion of Estonians and labor force participation rate among population between the ages 20 and 24 in the United States with a correlation coefficient (R) of 0.184 and weighted average of 75.6%. Similarly, the statistical analysis conducted on geographies consisting of 576,110,803 people shows a significant negative correlation between the proportion of Immigrants and labor force participation rate among population between the ages 20 and 24 in the United States with a correlation coefficient (R) of -0.699 and weighted average of 74.1%, a difference of 1.9%.
In Labor Force | Age 20-24 Correlation Summary
| Measurement | Estonian | Immigrants |
| Minimum | 16.7% | 49.3% |
| Maximum | 100.0% | 78.3% |
| Range | 83.3% | 29.0% |
| Mean | 77.2% | 72.3% |
| Median | 77.5% | 73.4% |
| Interquartile 25% (IQ1) | 71.9% | 70.2% |
| Interquartile 75% (IQ3) | 86.3% | 75.6% |
| Interquartile Range (IQR) | 14.4% | 5.4% |
| Standard Deviation (Sample) | 17.3% | 5.0% |
| Standard Deviation (Population) | 17.2% | 5.0% |
Similar Demographics by In Labor Force | Age 20-24
Demographics Similar to Estonians by In Labor Force | Age 20-24
In terms of in labor force | age 20-24, the demographic groups most similar to Estonians are Zimbabwean (75.6%, a difference of 0.040%), Immigrants from Jordan (75.6%, a difference of 0.050%), Palestinian (75.6%, a difference of 0.050%), Yaqui (75.5%, a difference of 0.050%), and Immigrants from Austria (75.6%, a difference of 0.060%).
| Demographics | Rating | Rank | In Labor Force | Age 20-24 |
| Sub-Saharan Africans | 90.9 /100 | #127 | Exceptional 75.7% |
| Immigrants | Afghanistan | 89.4 /100 | #128 | Excellent 75.6% |
| Iroquois | 89.1 /100 | #129 | Excellent 75.6% |
| Immigrants | Austria | 88.8 /100 | #130 | Excellent 75.6% |
| Immigrants | Jordan | 88.5 /100 | #131 | Excellent 75.6% |
| Palestinians | 88.4 /100 | #132 | Excellent 75.6% |
| Zimbabweans | 88.2 /100 | #133 | Excellent 75.6% |
| Estonians | 87.1 /100 | #134 | Excellent 75.6% |
| Yaqui | 85.5 /100 | #135 | Excellent 75.5% |
| Immigrants | Brazil | 84.8 /100 | #136 | Excellent 75.5% |
| Jordanians | 84.8 /100 | #137 | Excellent 75.5% |
| Australians | 84.8 /100 | #138 | Excellent 75.5% |
| Immigrants | England | 84.6 /100 | #139 | Excellent 75.5% |
| Delaware | 84.5 /100 | #140 | Excellent 75.5% |
| Romanians | 84.1 /100 | #141 | Excellent 75.5% |
Demographics Similar to Immigrants by In Labor Force | Age 20-24
In terms of in labor force | age 20-24, the demographic groups most similar to Immigrants are Immigrants from Chile (74.1%, a difference of 0.010%), Laotian (74.1%, a difference of 0.010%), Immigrants from France (74.1%, a difference of 0.030%), Bermudan (74.1%, a difference of 0.040%), and Immigrants from Switzerland (74.2%, a difference of 0.050%).
| Demographics | Rating | Rank | In Labor Force | Age 20-24 |
| Immigrants | Ireland | 5.8 /100 | #227 | Tragic 74.3% |
| Immigrants | Ukraine | 5.1 /100 | #228 | Tragic 74.2% |
| Immigrants | Sweden | 4.6 /100 | #229 | Tragic 74.2% |
| Immigrants | Albania | 4.3 /100 | #230 | Tragic 74.2% |
| Immigrants | Greece | 4.1 /100 | #231 | Tragic 74.2% |
| Immigrants | Switzerland | 4.1 /100 | #232 | Tragic 74.2% |
| Immigrants | Chile | 3.7 /100 | #233 | Tragic 74.1% |
| Immigrants | Immigrants | 3.6 /100 | #234 | Tragic 74.1% |
| Laotians | 3.5 /100 | #235 | Tragic 74.1% |
| Immigrants | France | 3.3 /100 | #236 | Tragic 74.1% |
| Bermudans | 3.2 /100 | #237 | Tragic 74.1% |
| Immigrants | Japan | 3.0 /100 | #238 | Tragic 74.1% |
| Immigrants | Latin America | 2.7 /100 | #239 | Tragic 74.1% |
| Immigrants | Sri Lanka | 2.3 /100 | #240 | Tragic 74.0% |
| Immigrants | Senegal | 2.1 /100 | #241 | Tragic 74.0% |