Immigrants from Argentina vs Chickasaw In Labor Force | Age 45-54
COMPARE
Immigrants from Argentina
Chickasaw
In Labor Force | Age 45-54
In Labor Force | Age 45-54 Comparison
Immigrants from Argentina
Chickasaw
83.3%
IN LABOR FORCE | AGE 45-54
94.9/ 100
METRIC RATING
95th/ 347
METRIC RANK
79.0%
IN LABOR FORCE | AGE 45-54
0.0/ 100
METRIC RATING
318th/ 347
METRIC RANK
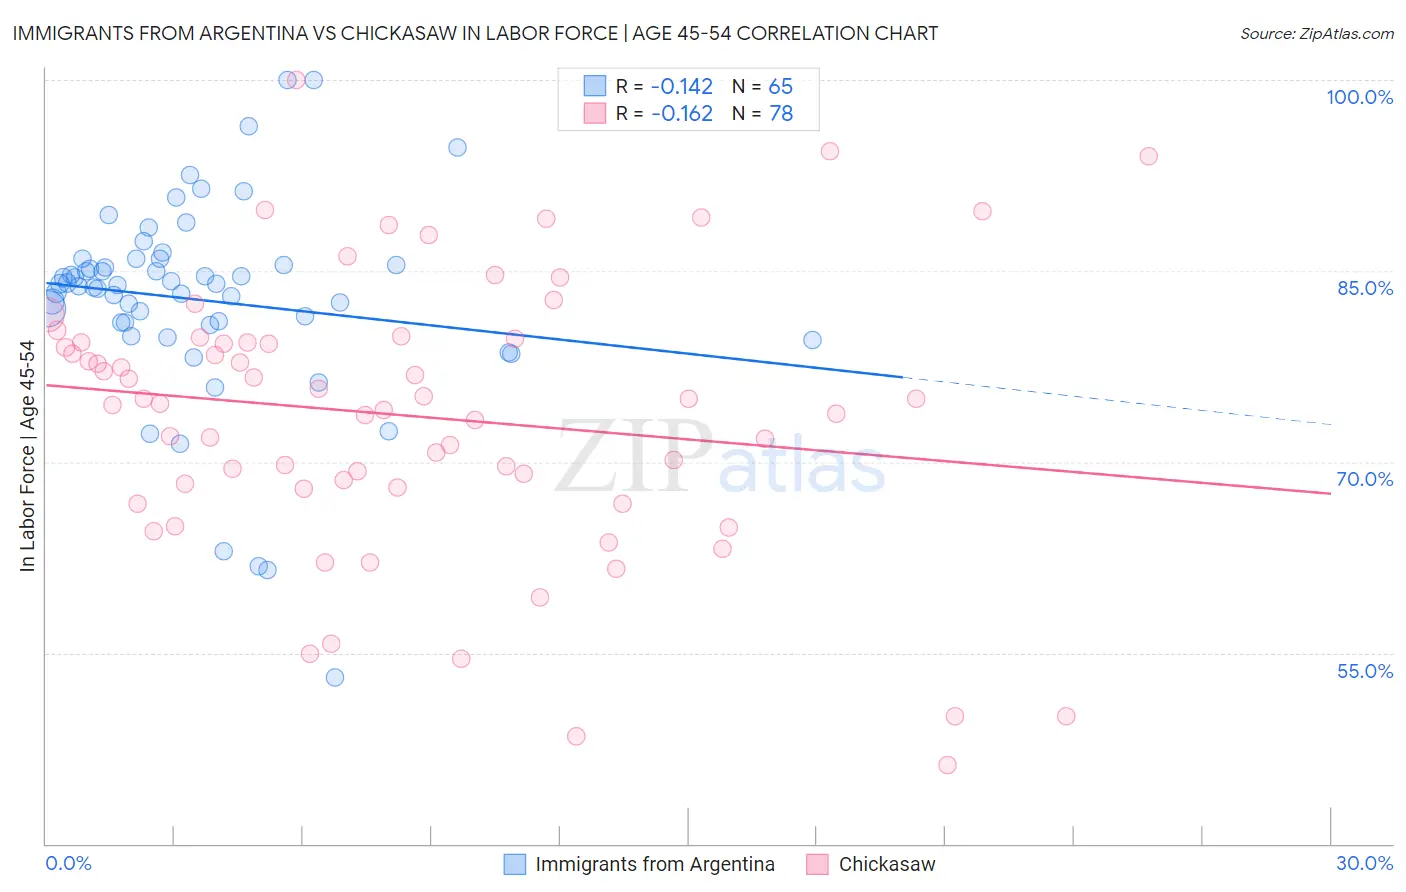
Immigrants from Argentina vs Chickasaw In Labor Force | Age 45-54 Correlation Chart
The statistical analysis conducted on geographies consisting of 264,349,552 people shows a poor negative correlation between the proportion of Immigrants from Argentina and labor force participation rate among population between the ages 45 and 54 in the United States with a correlation coefficient (R) of -0.142 and weighted average of 83.3%. Similarly, the statistical analysis conducted on geographies consisting of 147,675,622 people shows a poor negative correlation between the proportion of Chickasaw and labor force participation rate among population between the ages 45 and 54 in the United States with a correlation coefficient (R) of -0.162 and weighted average of 79.0%, a difference of 5.4%.
In Labor Force | Age 45-54 Correlation Summary
| Measurement | Immigrants from Argentina | Chickasaw |
| Minimum | 53.1% | 46.2% |
| Maximum | 100.0% | 100.0% |
| Range | 46.9% | 53.8% |
| Mean | 82.7% | 73.6% |
| Median | 83.9% | 74.8% |
| Interquartile 25% (IQ1) | 80.8% | 68.0% |
| Interquartile 75% (IQ3) | 85.7% | 79.4% |
| Interquartile Range (IQR) | 4.9% | 11.4% |
| Standard Deviation (Sample) | 8.1% | 10.8% |
| Standard Deviation (Population) | 8.0% | 10.7% |
Similar Demographics by In Labor Force | Age 45-54
Demographics Similar to Immigrants from Argentina by In Labor Force | Age 45-54
In terms of in labor force | age 45-54, the demographic groups most similar to Immigrants from Argentina are Argentinean (83.3%, a difference of 0.0%), Immigrants from Kuwait (83.3%, a difference of 0.0%), Palestinian (83.3%, a difference of 0.0%), Italian (83.3%, a difference of 0.010%), and Danish (83.3%, a difference of 0.020%).
| Demographics | Rating | Rank | In Labor Force | Age 45-54 |
| Immigrants | Asia | 95.6 /100 | #88 | Exceptional 83.3% |
| Indians (Asian) | 95.5 /100 | #89 | Exceptional 83.3% |
| Immigrants | Japan | 95.5 /100 | #90 | Exceptional 83.3% |
| South Americans | 95.5 /100 | #91 | Exceptional 83.3% |
| Danes | 95.3 /100 | #92 | Exceptional 83.3% |
| Italians | 95.1 /100 | #93 | Exceptional 83.3% |
| Argentineans | 94.9 /100 | #94 | Exceptional 83.3% |
| Immigrants | Argentina | 94.9 /100 | #95 | Exceptional 83.3% |
| Immigrants | Kuwait | 94.8 /100 | #96 | Exceptional 83.3% |
| Palestinians | 94.8 /100 | #97 | Exceptional 83.3% |
| Maltese | 94.4 /100 | #98 | Exceptional 83.3% |
| Immigrants | Middle Africa | 94.3 /100 | #99 | Exceptional 83.3% |
| Mongolians | 94.2 /100 | #100 | Exceptional 83.3% |
| Immigrants | Belarus | 94.1 /100 | #101 | Exceptional 83.3% |
| Immigrants | Singapore | 93.9 /100 | #102 | Exceptional 83.3% |
Demographics Similar to Chickasaw by In Labor Force | Age 45-54
In terms of in labor force | age 45-54, the demographic groups most similar to Chickasaw are Cherokee (79.0%, a difference of 0.10%), Comanche (79.2%, a difference of 0.17%), Yaqui (78.9%, a difference of 0.21%), Shoshone (79.3%, a difference of 0.31%), and Black/African American (79.3%, a difference of 0.39%).
| Demographics | Rating | Rank | In Labor Force | Age 45-54 |
| Mexicans | 0.0 /100 | #311 | Tragic 79.8% |
| Immigrants | Mexico | 0.0 /100 | #312 | Tragic 79.7% |
| Colville | 0.0 /100 | #313 | Tragic 79.5% |
| Ottawa | 0.0 /100 | #314 | Tragic 79.5% |
| Blacks/African Americans | 0.0 /100 | #315 | Tragic 79.3% |
| Shoshone | 0.0 /100 | #316 | Tragic 79.3% |
| Comanche | 0.0 /100 | #317 | Tragic 79.2% |
| Chickasaw | 0.0 /100 | #318 | Tragic 79.0% |
| Cherokee | 0.0 /100 | #319 | Tragic 79.0% |
| Yaqui | 0.0 /100 | #320 | Tragic 78.9% |
| Yup'ik | 0.0 /100 | #321 | Tragic 78.6% |
| Crow | 0.0 /100 | #322 | Tragic 78.3% |
| Kiowa | 0.0 /100 | #323 | Tragic 78.3% |
| Dutch West Indians | 0.0 /100 | #324 | Tragic 78.2% |
| Choctaw | 0.0 /100 | #325 | Tragic 78.2% |