Afghan vs Immigrants from Poland In Labor Force | Age 45-54
COMPARE
Afghan
Immigrants from Poland
In Labor Force | Age 45-54
In Labor Force | Age 45-54 Comparison
Afghans
Immigrants from Poland
83.5%
IN LABOR FORCE | AGE 45-54
97.9/ 100
METRIC RATING
63rd/ 347
METRIC RANK
83.6%
IN LABOR FORCE | AGE 45-54
99.0/ 100
METRIC RATING
48th/ 347
METRIC RANK
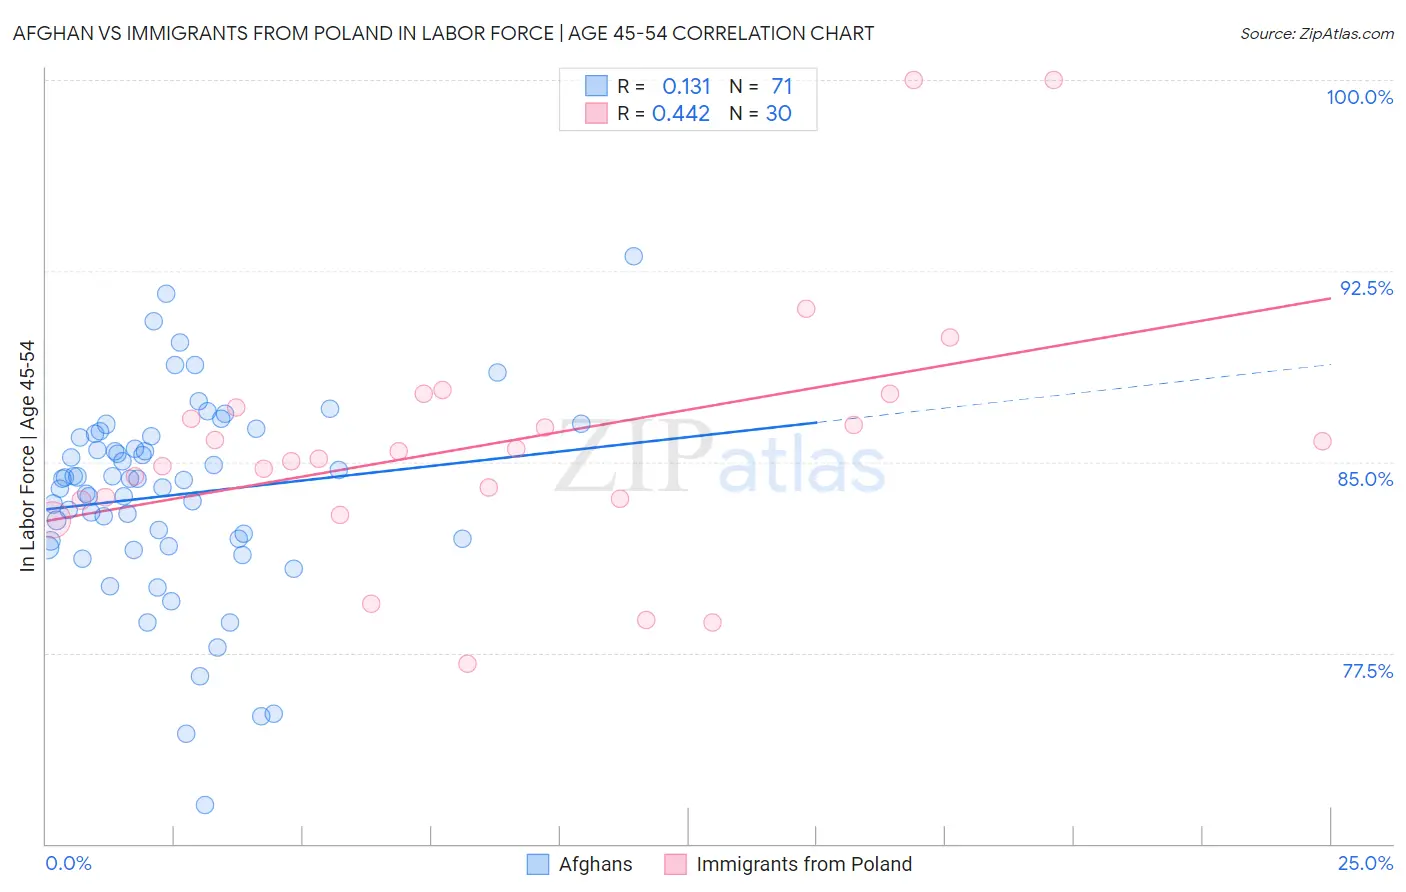
Afghan vs Immigrants from Poland In Labor Force | Age 45-54 Correlation Chart
The statistical analysis conducted on geographies consisting of 148,803,008 people shows a poor positive correlation between the proportion of Afghans and labor force participation rate among population between the ages 45 and 54 in the United States with a correlation coefficient (R) of 0.131 and weighted average of 83.5%. Similarly, the statistical analysis conducted on geographies consisting of 304,786,786 people shows a moderate positive correlation between the proportion of Immigrants from Poland and labor force participation rate among population between the ages 45 and 54 in the United States with a correlation coefficient (R) of 0.442 and weighted average of 83.6%, a difference of 0.16%.
In Labor Force | Age 45-54 Correlation Summary
| Measurement | Afghan | Immigrants from Poland |
| Minimum | 71.5% | 77.1% |
| Maximum | 93.1% | 100.0% |
| Range | 21.6% | 22.9% |
| Mean | 83.7% | 85.7% |
| Median | 84.3% | 85.3% |
| Interquartile 25% (IQ1) | 81.9% | 83.5% |
| Interquartile 75% (IQ3) | 86.0% | 87.2% |
| Interquartile Range (IQR) | 4.1% | 3.6% |
| Standard Deviation (Sample) | 3.9% | 5.0% |
| Standard Deviation (Population) | 3.8% | 4.9% |
Demographics Similar to Afghans and Immigrants from Poland by In Labor Force | Age 45-54
In terms of in labor force | age 45-54, the demographic groups most similar to Afghans are Immigrants from Kenya (83.5%, a difference of 0.0%), Immigrants from Taiwan (83.5%, a difference of 0.010%), Egyptian (83.5%, a difference of 0.010%), Filipino (83.5%, a difference of 0.040%), and Bhutanese (83.5%, a difference of 0.050%). Similarly, the demographic groups most similar to Immigrants from Poland are Immigrants from Morocco (83.6%, a difference of 0.0%), Croatian (83.6%, a difference of 0.010%), Lithuanian (83.6%, a difference of 0.020%), Immigrants from Hong Kong (83.6%, a difference of 0.030%), and Immigrants from Greece (83.6%, a difference of 0.030%).
| Demographics | Rating | Rank | In Labor Force | Age 45-54 |
| Immigrants | Hong Kong | 99.1 /100 | #45 | Exceptional 83.6% |
| Lithuanians | 99.1 /100 | #46 | Exceptional 83.6% |
| Croatians | 99.0 /100 | #47 | Exceptional 83.6% |
| Immigrants | Poland | 99.0 /100 | #48 | Exceptional 83.6% |
| Immigrants | Morocco | 99.0 /100 | #49 | Exceptional 83.6% |
| Immigrants | Greece | 98.8 /100 | #50 | Exceptional 83.6% |
| Immigrants | Turkey | 98.8 /100 | #51 | Exceptional 83.6% |
| Poles | 98.7 /100 | #52 | Exceptional 83.6% |
| Peruvians | 98.7 /100 | #53 | Exceptional 83.6% |
| Somalis | 98.7 /100 | #54 | Exceptional 83.5% |
| Macedonians | 98.7 /100 | #55 | Exceptional 83.5% |
| Immigrants | Peru | 98.6 /100 | #56 | Exceptional 83.5% |
| Paraguayans | 98.5 /100 | #57 | Exceptional 83.5% |
| Eastern Europeans | 98.5 /100 | #58 | Exceptional 83.5% |
| Bhutanese | 98.3 /100 | #59 | Exceptional 83.5% |
| Carpatho Rusyns | 98.3 /100 | #60 | Exceptional 83.5% |
| Filipinos | 98.3 /100 | #61 | Exceptional 83.5% |
| Immigrants | Taiwan | 98.0 /100 | #62 | Exceptional 83.5% |
| Afghans | 97.9 /100 | #63 | Exceptional 83.5% |
| Immigrants | Kenya | 97.9 /100 | #64 | Exceptional 83.5% |
| Egyptians | 97.9 /100 | #65 | Exceptional 83.5% |