Zimbabwean vs Chickasaw Median Female Earnings
COMPARE
Zimbabwean
Chickasaw
Median Female Earnings
Median Female Earnings Comparison
Zimbabweans
Chickasaw
$40,798
MEDIAN FEMALE EARNINGS
90.8/ 100
METRIC RATING
129th/ 347
METRIC RANK
$34,414
MEDIAN FEMALE EARNINGS
0.0/ 100
METRIC RATING
322nd/ 347
METRIC RANK
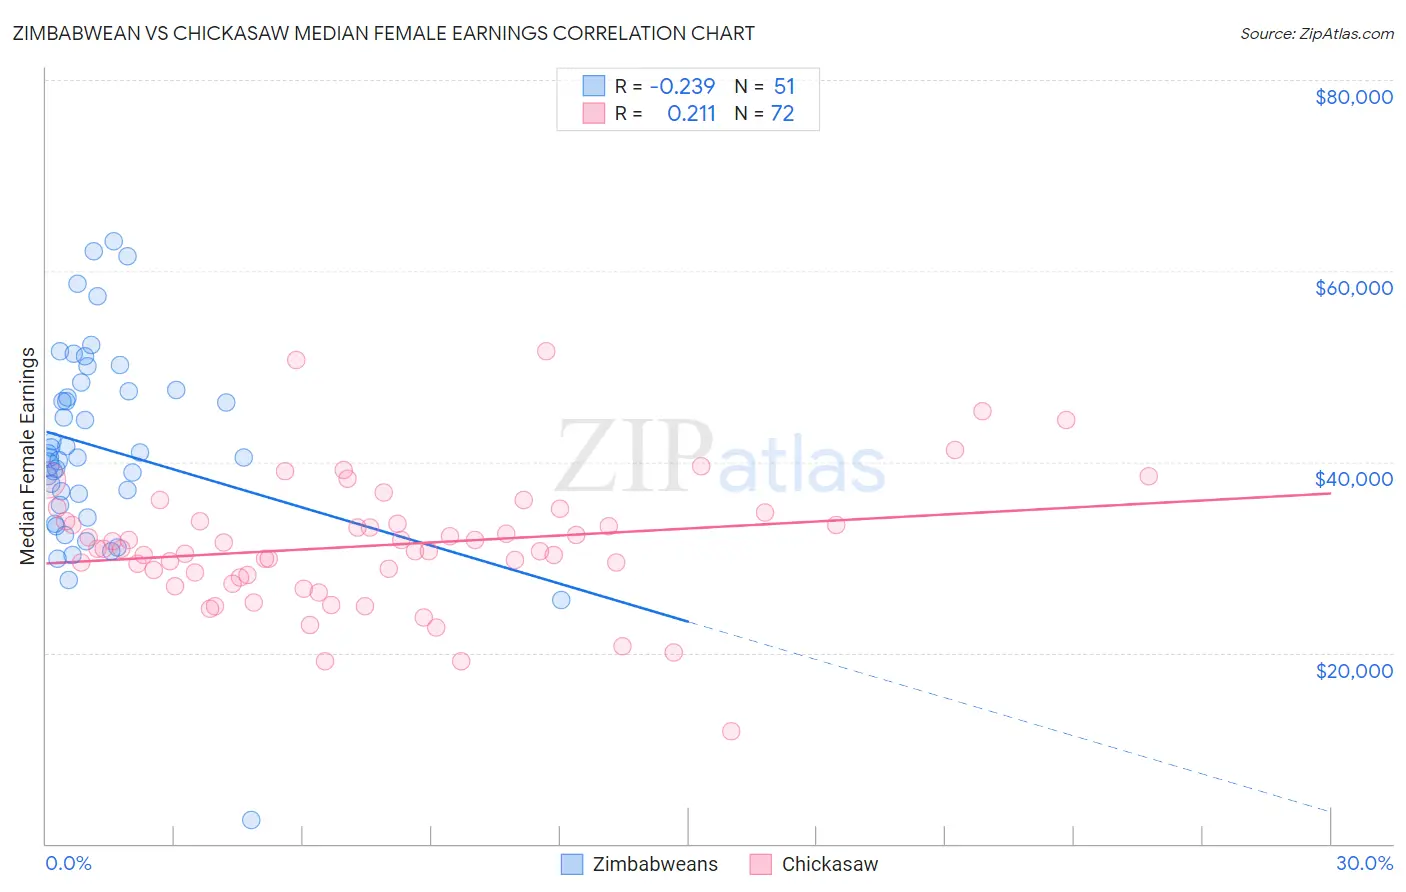
Zimbabwean vs Chickasaw Median Female Earnings Correlation Chart
The statistical analysis conducted on geographies consisting of 69,205,831 people shows a weak negative correlation between the proportion of Zimbabweans and median female earnings in the United States with a correlation coefficient (R) of -0.239 and weighted average of $40,798. Similarly, the statistical analysis conducted on geographies consisting of 147,680,530 people shows a weak positive correlation between the proportion of Chickasaw and median female earnings in the United States with a correlation coefficient (R) of 0.211 and weighted average of $34,414, a difference of 18.5%.
Median Female Earnings Correlation Summary
| Measurement | Zimbabwean | Chickasaw |
| Minimum | $2,499 | $11,797 |
| Maximum | $63,108 | $51,543 |
| Range | $60,609 | $39,746 |
| Mean | $41,512 | $31,266 |
| Median | $40,486 | $30,877 |
| Interquartile 25% (IQ1) | $35,420 | $28,026 |
| Interquartile 75% (IQ3) | $47,538 | $33,779 |
| Interquartile Range (IQR) | $12,118 | $5,753 |
| Standard Deviation (Sample) | $10,575 | $6,735 |
| Standard Deviation (Population) | $10,471 | $6,688 |
Similar Demographics by Median Female Earnings
Demographics Similar to Zimbabweans by Median Female Earnings
In terms of median female earnings, the demographic groups most similar to Zimbabweans are Immigrants from Guyana ($40,773, a difference of 0.060%), Carpatho Rusyn ($40,825, a difference of 0.070%), Chilean ($40,757, a difference of 0.10%), Immigrants from Uganda ($40,739, a difference of 0.14%), and Syrian ($40,727, a difference of 0.17%).
| Demographics | Rating | Rank | Median Female Earnings |
| Immigrants | Jordan | 93.5 /100 | #122 | Exceptional $40,977 |
| Guyanese | 93.4 /100 | #123 | Exceptional $40,973 |
| Trinidadians and Tobagonians | 93.2 /100 | #124 | Exceptional $40,958 |
| Austrians | 92.7 /100 | #125 | Exceptional $40,923 |
| Immigrants | Trinidad and Tobago | 92.3 /100 | #126 | Exceptional $40,895 |
| Ugandans | 92.2 /100 | #127 | Exceptional $40,889 |
| Carpatho Rusyns | 91.2 /100 | #128 | Exceptional $40,825 |
| Zimbabweans | 90.8 /100 | #129 | Exceptional $40,798 |
| Immigrants | Guyana | 90.3 /100 | #130 | Exceptional $40,773 |
| Chileans | 90.0 /100 | #131 | Exceptional $40,757 |
| Immigrants | Uganda | 89.7 /100 | #132 | Excellent $40,739 |
| Syrians | 89.5 /100 | #133 | Excellent $40,727 |
| Arabs | 89.3 /100 | #134 | Excellent $40,718 |
| Immigrants | Nepal | 89.0 /100 | #135 | Excellent $40,704 |
| Immigrants | Eastern Africa | 87.7 /100 | #136 | Excellent $40,644 |
Demographics Similar to Chickasaw by Median Female Earnings
In terms of median female earnings, the demographic groups most similar to Chickasaw are Hispanic or Latino ($34,421, a difference of 0.020%), Seminole ($34,385, a difference of 0.080%), Immigrants from Congo ($34,317, a difference of 0.28%), Immigrants from Honduras ($34,647, a difference of 0.68%), and Shoshone ($34,677, a difference of 0.76%).
| Demographics | Rating | Rank | Median Female Earnings |
| Pennsylvania Germans | 0.0 /100 | #315 | Tragic $34,802 |
| Cherokee | 0.0 /100 | #316 | Tragic $34,742 |
| Potawatomi | 0.0 /100 | #317 | Tragic $34,739 |
| Immigrants | Yemen | 0.0 /100 | #318 | Tragic $34,693 |
| Shoshone | 0.0 /100 | #319 | Tragic $34,677 |
| Immigrants | Honduras | 0.0 /100 | #320 | Tragic $34,647 |
| Hispanics or Latinos | 0.0 /100 | #321 | Tragic $34,421 |
| Chickasaw | 0.0 /100 | #322 | Tragic $34,414 |
| Seminole | 0.0 /100 | #323 | Tragic $34,385 |
| Immigrants | Congo | 0.0 /100 | #324 | Tragic $34,317 |
| Dutch West Indians | 0.0 /100 | #325 | Tragic $34,106 |
| Kiowa | 0.0 /100 | #326 | Tragic $34,074 |
| Cajuns | 0.0 /100 | #327 | Tragic $34,034 |
| Immigrants | Central America | 0.0 /100 | #328 | Tragic $33,953 |
| Hopi | 0.0 /100 | #329 | Tragic $33,932 |