Zimbabwean vs Immigrants from Cameroon Median Female Earnings
COMPARE
Zimbabwean
Immigrants from Cameroon
Median Female Earnings
Median Female Earnings Comparison
Zimbabweans
Immigrants from Cameroon
$40,798
MEDIAN FEMALE EARNINGS
90.8/ 100
METRIC RATING
129th/ 347
METRIC RANK
$40,354
MEDIAN FEMALE EARNINGS
79.7/ 100
METRIC RATING
149th/ 347
METRIC RANK
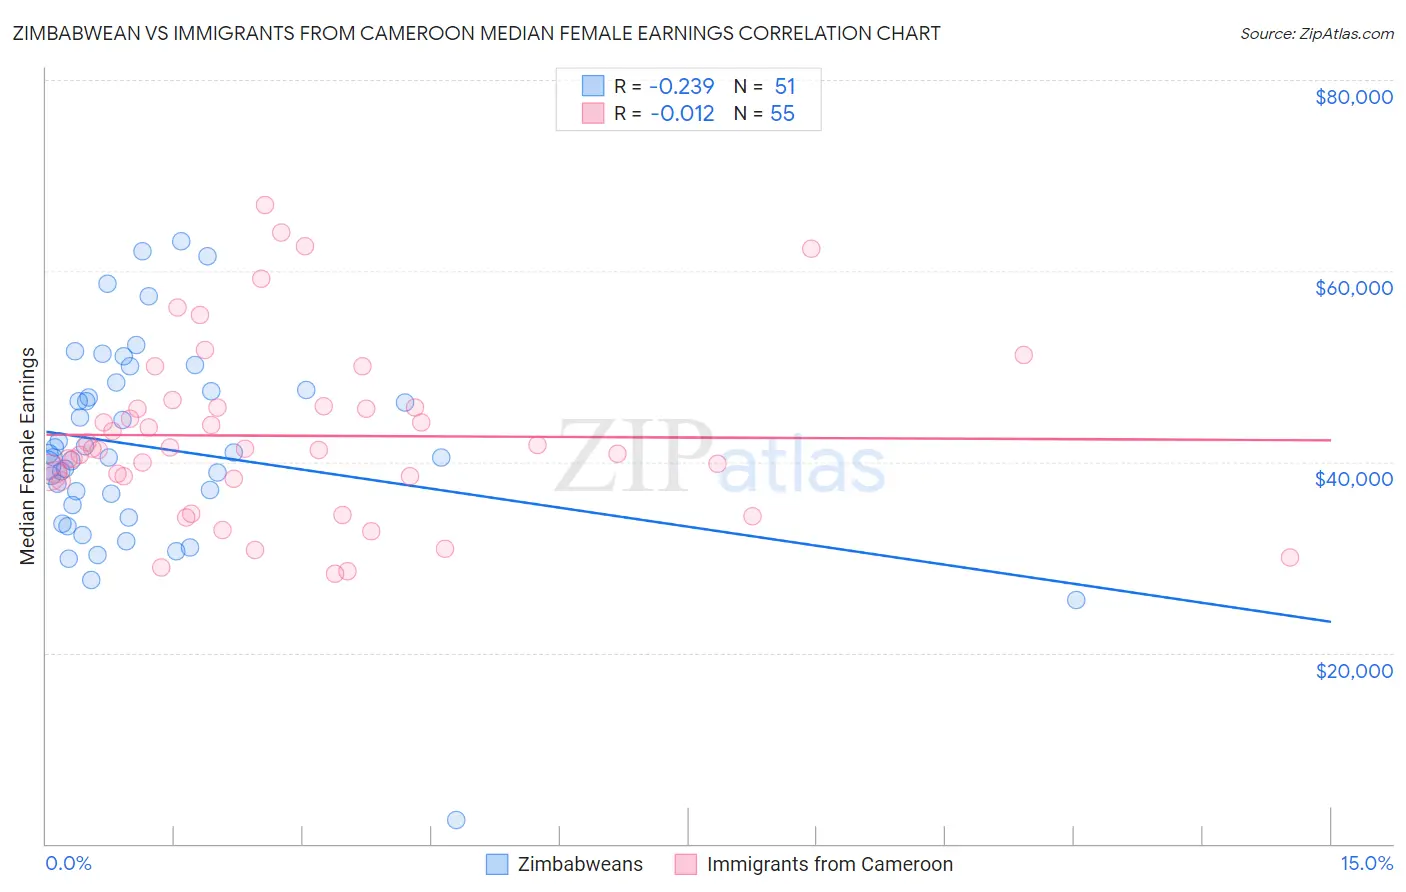
Zimbabwean vs Immigrants from Cameroon Median Female Earnings Correlation Chart
The statistical analysis conducted on geographies consisting of 69,205,831 people shows a weak negative correlation between the proportion of Zimbabweans and median female earnings in the United States with a correlation coefficient (R) of -0.239 and weighted average of $40,798. Similarly, the statistical analysis conducted on geographies consisting of 130,684,247 people shows no correlation between the proportion of Immigrants from Cameroon and median female earnings in the United States with a correlation coefficient (R) of -0.012 and weighted average of $40,354, a difference of 1.1%.
Median Female Earnings Correlation Summary
| Measurement | Zimbabwean | Immigrants from Cameroon |
| Minimum | $2,499 | $28,227 |
| Maximum | $63,108 | $66,884 |
| Range | $60,609 | $38,657 |
| Mean | $41,512 | $42,735 |
| Median | $40,486 | $41,397 |
| Interquartile 25% (IQ1) | $35,420 | $38,192 |
| Interquartile 75% (IQ3) | $47,538 | $45,723 |
| Interquartile Range (IQR) | $12,118 | $7,531 |
| Standard Deviation (Sample) | $10,575 | $9,076 |
| Standard Deviation (Population) | $10,471 | $8,993 |
Demographics Similar to Zimbabweans and Immigrants from Cameroon by Median Female Earnings
In terms of median female earnings, the demographic groups most similar to Zimbabweans are Immigrants from Guyana ($40,773, a difference of 0.060%), Chilean ($40,757, a difference of 0.10%), Immigrants from Uganda ($40,739, a difference of 0.14%), Syrian ($40,727, a difference of 0.17%), and Arab ($40,718, a difference of 0.20%). Similarly, the demographic groups most similar to Immigrants from Cameroon are Polish ($40,371, a difference of 0.040%), Vietnamese ($40,377, a difference of 0.060%), Ghanaian ($40,429, a difference of 0.19%), Brazilian ($40,483, a difference of 0.32%), and Immigrants from North Macedonia ($40,488, a difference of 0.33%).
| Demographics | Rating | Rank | Median Female Earnings |
| Zimbabweans | 90.8 /100 | #129 | Exceptional $40,798 |
| Immigrants | Guyana | 90.3 /100 | #130 | Exceptional $40,773 |
| Chileans | 90.0 /100 | #131 | Exceptional $40,757 |
| Immigrants | Uganda | 89.7 /100 | #132 | Excellent $40,739 |
| Syrians | 89.5 /100 | #133 | Excellent $40,727 |
| Arabs | 89.3 /100 | #134 | Excellent $40,718 |
| Immigrants | Nepal | 89.0 /100 | #135 | Excellent $40,704 |
| Immigrants | Eastern Africa | 87.7 /100 | #136 | Excellent $40,644 |
| Pakistanis | 86.6 /100 | #137 | Excellent $40,596 |
| Taiwanese | 86.1 /100 | #138 | Excellent $40,576 |
| Immigrants | South Eastern Asia | 85.7 /100 | #139 | Excellent $40,558 |
| Serbians | 85.2 /100 | #140 | Excellent $40,539 |
| Immigrants | Syria | 84.1 /100 | #141 | Excellent $40,499 |
| Sri Lankans | 84.0 /100 | #142 | Excellent $40,496 |
| Northern Europeans | 83.9 /100 | #143 | Excellent $40,491 |
| Immigrants | North Macedonia | 83.8 /100 | #144 | Excellent $40,488 |
| Brazilians | 83.6 /100 | #145 | Excellent $40,483 |
| Ghanaians | 82.1 /100 | #146 | Excellent $40,429 |
| Vietnamese | 80.4 /100 | #147 | Excellent $40,377 |
| Poles | 80.2 /100 | #148 | Excellent $40,371 |
| Immigrants | Cameroon | 79.7 /100 | #149 | Good $40,354 |