Zimbabwean vs Immigrants from Lebanon Median Female Earnings
COMPARE
Zimbabwean
Immigrants from Lebanon
Median Female Earnings
Median Female Earnings Comparison
Zimbabweans
Immigrants from Lebanon
$40,798
MEDIAN FEMALE EARNINGS
90.8/ 100
METRIC RATING
129th/ 347
METRIC RANK
$41,183
MEDIAN FEMALE EARNINGS
95.6/ 100
METRIC RATING
118th/ 347
METRIC RANK
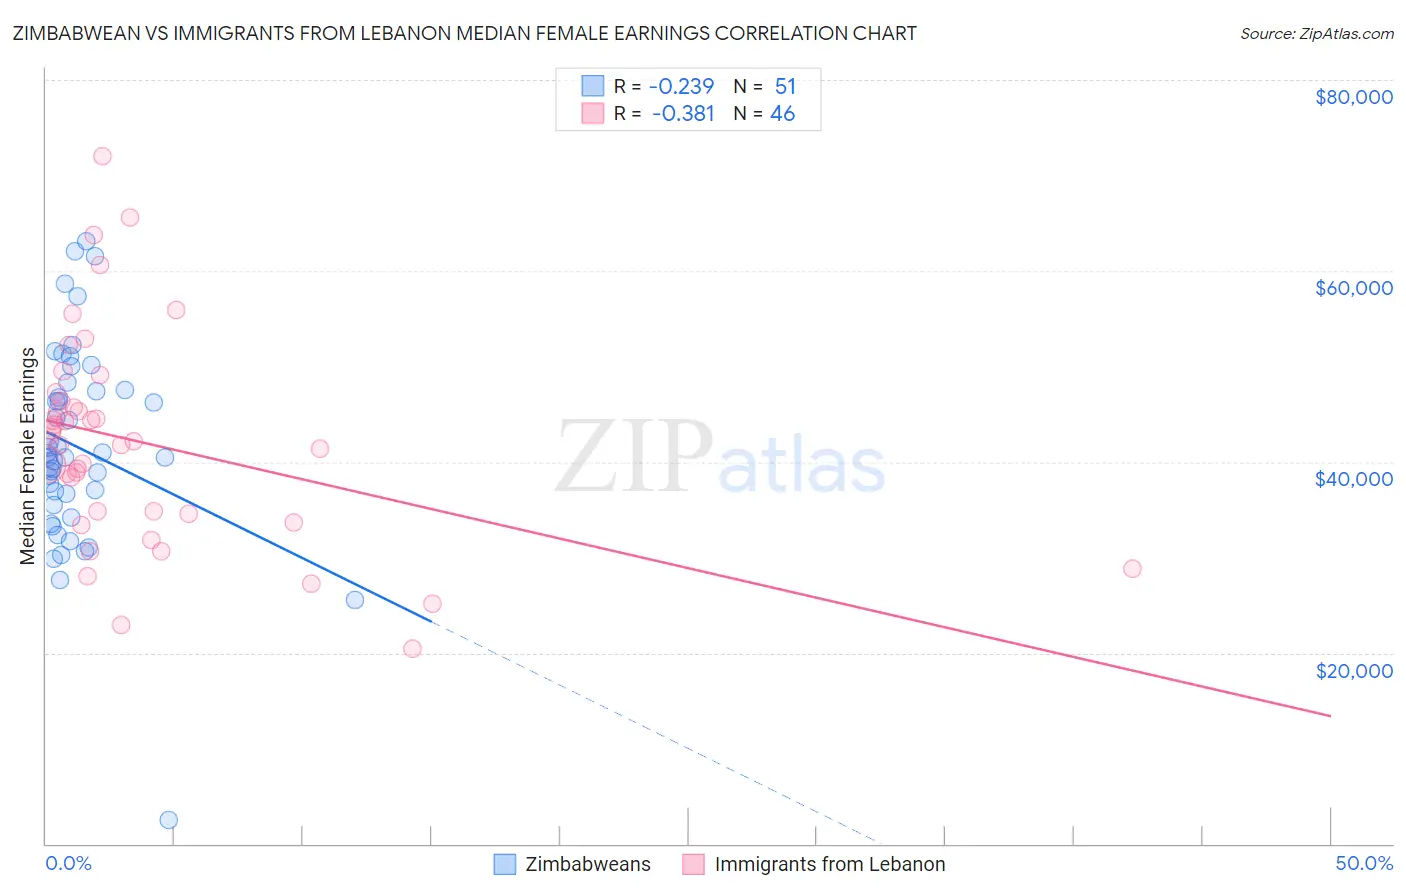
Zimbabwean vs Immigrants from Lebanon Median Female Earnings Correlation Chart
The statistical analysis conducted on geographies consisting of 69,205,831 people shows a weak negative correlation between the proportion of Zimbabweans and median female earnings in the United States with a correlation coefficient (R) of -0.239 and weighted average of $40,798. Similarly, the statistical analysis conducted on geographies consisting of 217,136,243 people shows a mild negative correlation between the proportion of Immigrants from Lebanon and median female earnings in the United States with a correlation coefficient (R) of -0.381 and weighted average of $41,183, a difference of 0.94%.
Median Female Earnings Correlation Summary
| Measurement | Zimbabwean | Immigrants from Lebanon |
| Minimum | $2,499 | $20,406 |
| Maximum | $63,108 | $72,000 |
| Range | $60,609 | $51,594 |
| Mean | $41,512 | $42,035 |
| Median | $40,486 | $41,983 |
| Interquartile 25% (IQ1) | $35,420 | $34,539 |
| Interquartile 75% (IQ3) | $47,538 | $46,364 |
| Interquartile Range (IQR) | $12,118 | $11,825 |
| Standard Deviation (Sample) | $10,575 | $11,071 |
| Standard Deviation (Population) | $10,471 | $10,950 |
Demographics Similar to Zimbabweans and Immigrants from Lebanon by Median Female Earnings
In terms of median female earnings, the demographic groups most similar to Zimbabweans are Immigrants from Guyana ($40,773, a difference of 0.060%), Carpatho Rusyn ($40,825, a difference of 0.070%), Chilean ($40,757, a difference of 0.10%), Immigrants from Uganda ($40,739, a difference of 0.14%), and Syrian ($40,727, a difference of 0.17%). Similarly, the demographic groups most similar to Immigrants from Lebanon are Immigrants from Philippines ($41,114, a difference of 0.17%), Barbadian ($41,261, a difference of 0.19%), Immigrants from Brazil ($41,273, a difference of 0.22%), Immigrants from England ($41,277, a difference of 0.23%), and Korean ($41,276, a difference of 0.23%).
| Demographics | Rating | Rank | Median Female Earnings |
| Macedonians | 96.4 /100 | #113 | Exceptional $41,286 |
| Immigrants | England | 96.4 /100 | #114 | Exceptional $41,277 |
| Koreans | 96.4 /100 | #115 | Exceptional $41,276 |
| Immigrants | Brazil | 96.4 /100 | #116 | Exceptional $41,273 |
| Barbadians | 96.3 /100 | #117 | Exceptional $41,261 |
| Immigrants | Lebanon | 95.6 /100 | #118 | Exceptional $41,183 |
| Immigrants | Philippines | 95.0 /100 | #119 | Exceptional $41,114 |
| Immigrants | Kuwait | 94.4 /100 | #120 | Exceptional $41,055 |
| Croatians | 93.7 /100 | #121 | Exceptional $40,993 |
| Immigrants | Jordan | 93.5 /100 | #122 | Exceptional $40,977 |
| Guyanese | 93.4 /100 | #123 | Exceptional $40,973 |
| Trinidadians and Tobagonians | 93.2 /100 | #124 | Exceptional $40,958 |
| Austrians | 92.7 /100 | #125 | Exceptional $40,923 |
| Immigrants | Trinidad and Tobago | 92.3 /100 | #126 | Exceptional $40,895 |
| Ugandans | 92.2 /100 | #127 | Exceptional $40,889 |
| Carpatho Rusyns | 91.2 /100 | #128 | Exceptional $40,825 |
| Zimbabweans | 90.8 /100 | #129 | Exceptional $40,798 |
| Immigrants | Guyana | 90.3 /100 | #130 | Exceptional $40,773 |
| Chileans | 90.0 /100 | #131 | Exceptional $40,757 |
| Immigrants | Uganda | 89.7 /100 | #132 | Excellent $40,739 |
| Syrians | 89.5 /100 | #133 | Excellent $40,727 |