Zimbabwean vs Indian (Asian) Median Household Income
COMPARE
Zimbabwean
Indian (Asian)
Median Household Income
Median Household Income Comparison
Zimbabweans
Indians (Asian)
$90,618
MEDIAN HOUSEHOLD INCOME
97.2/ 100
METRIC RATING
108th/ 347
METRIC RANK
$105,262
MEDIAN HOUSEHOLD INCOME
100.0/ 100
METRIC RATING
12th/ 347
METRIC RANK
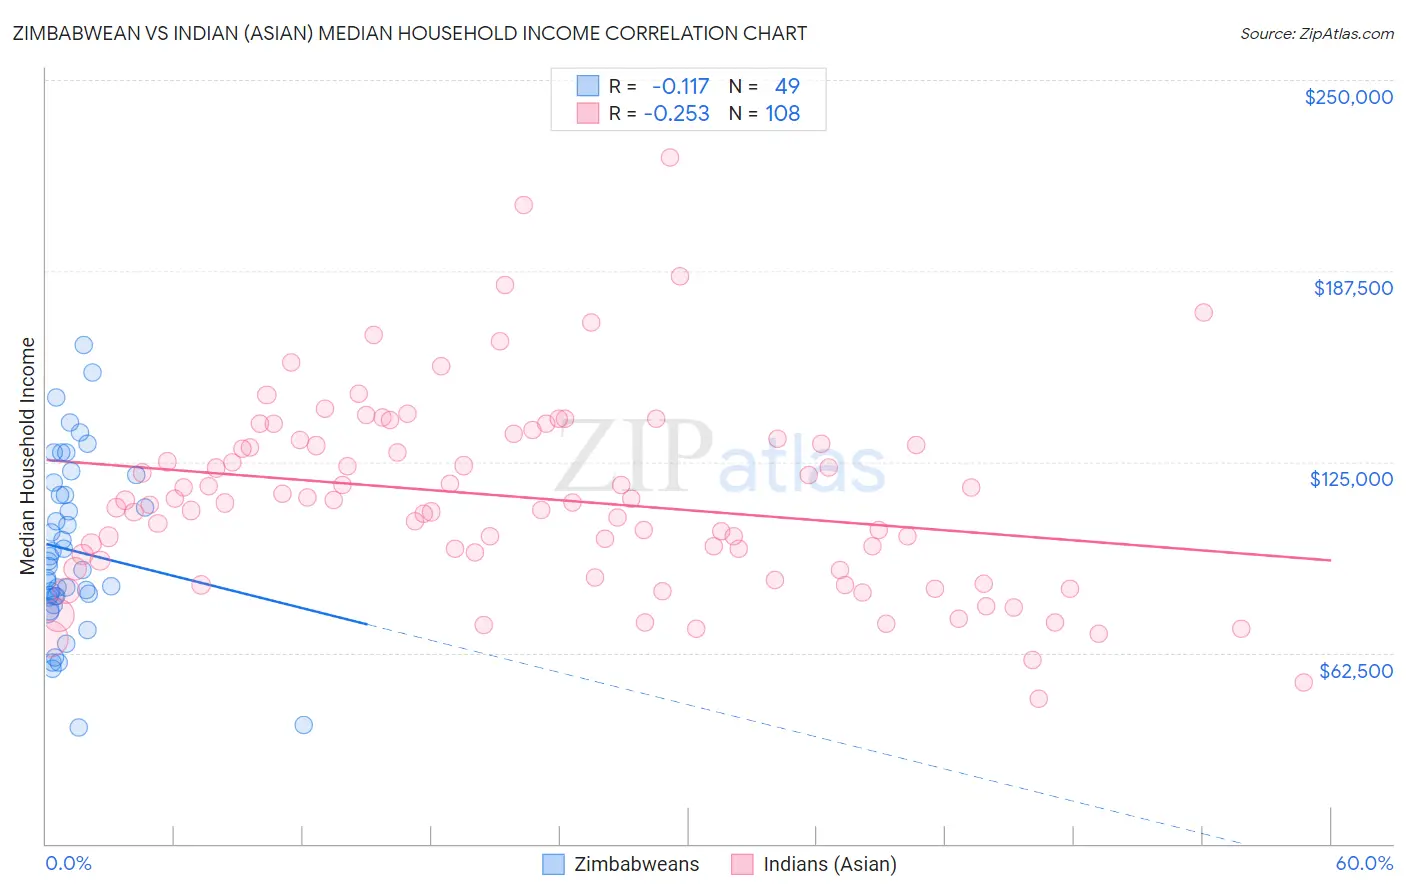
Zimbabwean vs Indian (Asian) Median Household Income Correlation Chart
The statistical analysis conducted on geographies consisting of 69,185,411 people shows a poor negative correlation between the proportion of Zimbabweans and median household income in the United States with a correlation coefficient (R) of -0.117 and weighted average of $90,618. Similarly, the statistical analysis conducted on geographies consisting of 494,532,621 people shows a weak negative correlation between the proportion of Indians (Asian) and median household income in the United States with a correlation coefficient (R) of -0.253 and weighted average of $105,262, a difference of 16.2%.
Median Household Income Correlation Summary
| Measurement | Zimbabwean | Indian (Asian) |
| Minimum | $38,056 | $47,386 |
| Maximum | $163,274 | $224,427 |
| Range | $125,218 | $177,041 |
| Mean | $96,050 | $113,272 |
| Median | $90,998 | $111,615 |
| Interquartile 25% (IQ1) | $80,817 | $91,317 |
| Interquartile 75% (IQ3) | $116,275 | $131,580 |
| Interquartile Range (IQR) | $35,458 | $40,263 |
| Standard Deviation (Sample) | $28,116 | $31,514 |
| Standard Deviation (Population) | $27,827 | $31,368 |
Similar Demographics by Median Household Income
Demographics Similar to Zimbabweans by Median Household Income
In terms of median household income, the demographic groups most similar to Zimbabweans are Chilean ($90,605, a difference of 0.020%), Palestinian ($90,574, a difference of 0.050%), Croatian ($90,685, a difference of 0.070%), Immigrants from Poland ($90,549, a difference of 0.080%), and Macedonian ($90,761, a difference of 0.16%).
| Demographics | Rating | Rank | Median Household Income |
| Immigrants | Moldova | 98.3 /100 | #101 | Exceptional $91,446 |
| Austrians | 98.2 /100 | #102 | Exceptional $91,339 |
| Immigrants | Ukraine | 98.0 /100 | #103 | Exceptional $91,124 |
| Immigrants | Kazakhstan | 97.8 /100 | #104 | Exceptional $91,015 |
| Immigrants | Brazil | 97.7 /100 | #105 | Exceptional $90,907 |
| Macedonians | 97.4 /100 | #106 | Exceptional $90,761 |
| Croatians | 97.3 /100 | #107 | Exceptional $90,685 |
| Zimbabweans | 97.2 /100 | #108 | Exceptional $90,618 |
| Chileans | 97.2 /100 | #109 | Exceptional $90,605 |
| Palestinians | 97.1 /100 | #110 | Exceptional $90,574 |
| Immigrants | Poland | 97.1 /100 | #111 | Exceptional $90,549 |
| Northern Europeans | 96.9 /100 | #112 | Exceptional $90,446 |
| Peruvians | 96.5 /100 | #113 | Exceptional $90,261 |
| Immigrants | Northern Africa | 95.9 /100 | #114 | Exceptional $90,026 |
| Immigrants | Western Asia | 95.9 /100 | #115 | Exceptional $90,005 |
Demographics Similar to Indians (Asian) by Median Household Income
In terms of median household income, the demographic groups most similar to Indians (Asian) are Immigrants from China ($105,335, a difference of 0.070%), Immigrants from Eastern Asia ($104,796, a difference of 0.45%), Immigrants from Ireland ($104,692, a difference of 0.54%), Immigrants from South Central Asia ($106,057, a difference of 0.76%), and Immigrants from Israel ($104,090, a difference of 1.1%).
| Demographics | Rating | Rank | Median Household Income |
| Thais | 100.0 /100 | #5 | Exceptional $110,648 |
| Immigrants | Singapore | 100.0 /100 | #6 | Exceptional $110,428 |
| Iranians | 100.0 /100 | #7 | Exceptional $109,835 |
| Immigrants | Iran | 100.0 /100 | #8 | Exceptional $108,055 |
| Okinawans | 100.0 /100 | #9 | Exceptional $106,624 |
| Immigrants | South Central Asia | 100.0 /100 | #10 | Exceptional $106,057 |
| Immigrants | China | 100.0 /100 | #11 | Exceptional $105,335 |
| Indians (Asian) | 100.0 /100 | #12 | Exceptional $105,262 |
| Immigrants | Eastern Asia | 100.0 /100 | #13 | Exceptional $104,796 |
| Immigrants | Ireland | 100.0 /100 | #14 | Exceptional $104,692 |
| Immigrants | Israel | 100.0 /100 | #15 | Exceptional $104,090 |
| Burmese | 100.0 /100 | #16 | Exceptional $103,145 |
| Immigrants | Korea | 100.0 /100 | #17 | Exceptional $102,962 |
| Cypriots | 100.0 /100 | #18 | Exceptional $102,843 |
| Immigrants | Australia | 100.0 /100 | #19 | Exceptional $102,562 |