Zimbabwean vs Ecuadorian Median Household Income
COMPARE
Zimbabwean
Ecuadorian
Median Household Income
Median Household Income Comparison
Zimbabweans
Ecuadorians
$90,618
MEDIAN HOUSEHOLD INCOME
97.2/ 100
METRIC RATING
108th/ 347
METRIC RANK
$82,070
MEDIAN HOUSEHOLD INCOME
12.5/ 100
METRIC RATING
217th/ 347
METRIC RANK
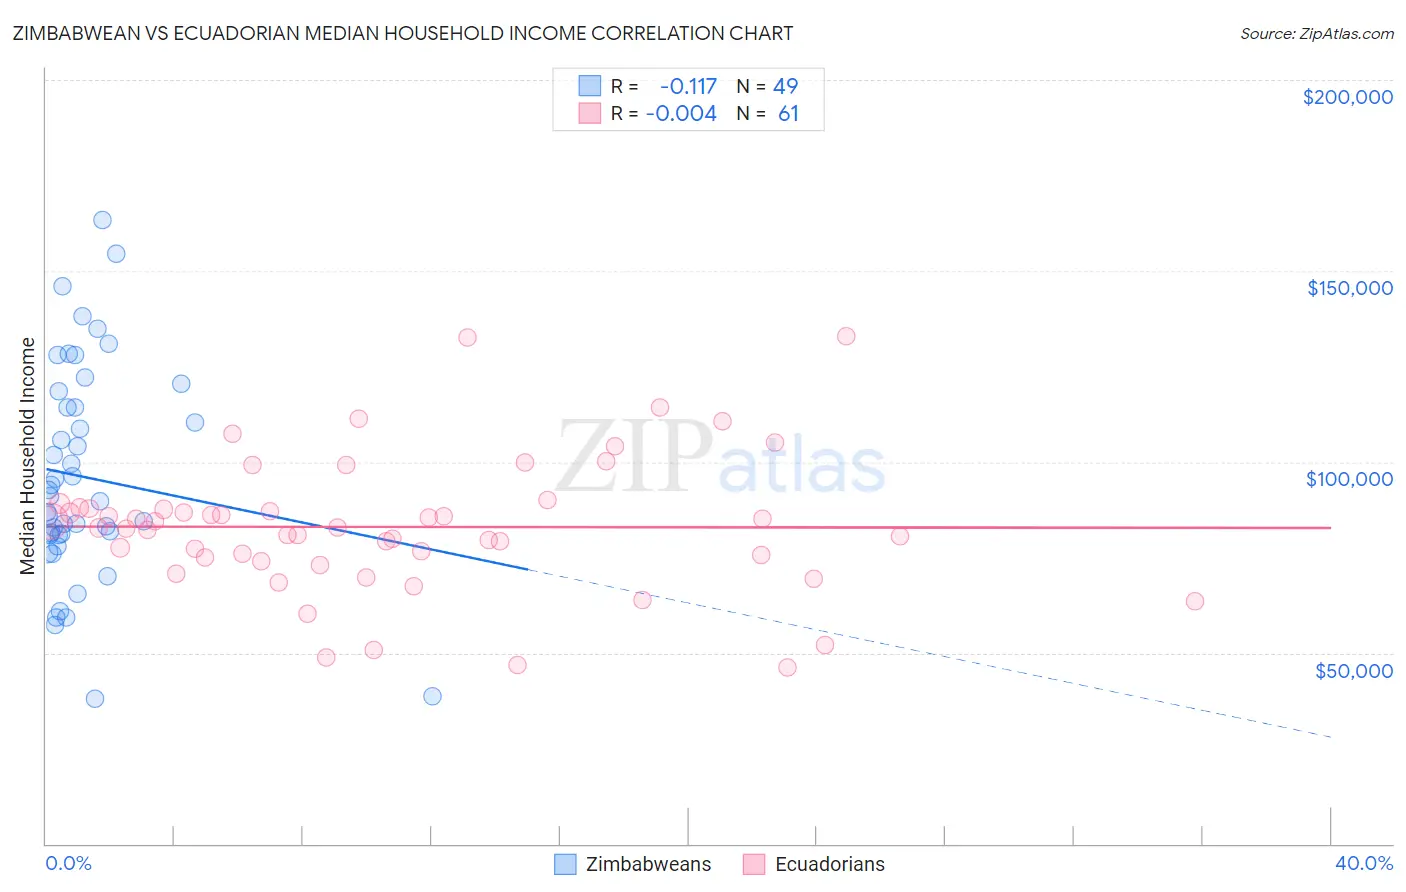
Zimbabwean vs Ecuadorian Median Household Income Correlation Chart
The statistical analysis conducted on geographies consisting of 69,185,411 people shows a poor negative correlation between the proportion of Zimbabweans and median household income in the United States with a correlation coefficient (R) of -0.117 and weighted average of $90,618. Similarly, the statistical analysis conducted on geographies consisting of 317,572,245 people shows no correlation between the proportion of Ecuadorians and median household income in the United States with a correlation coefficient (R) of -0.004 and weighted average of $82,070, a difference of 10.4%.
Median Household Income Correlation Summary
| Measurement | Zimbabwean | Ecuadorian |
| Minimum | $38,056 | $46,188 |
| Maximum | $163,274 | $132,837 |
| Range | $125,218 | $86,649 |
| Mean | $96,050 | $82,960 |
| Median | $90,998 | $82,671 |
| Interquartile 25% (IQ1) | $80,817 | $74,469 |
| Interquartile 75% (IQ3) | $116,275 | $87,872 |
| Interquartile Range (IQR) | $35,458 | $13,403 |
| Standard Deviation (Sample) | $28,116 | $17,786 |
| Standard Deviation (Population) | $27,827 | $17,640 |
Similar Demographics by Median Household Income
Demographics Similar to Zimbabweans by Median Household Income
In terms of median household income, the demographic groups most similar to Zimbabweans are Chilean ($90,605, a difference of 0.020%), Palestinian ($90,574, a difference of 0.050%), Croatian ($90,685, a difference of 0.070%), Immigrants from Poland ($90,549, a difference of 0.080%), and Macedonian ($90,761, a difference of 0.16%).
| Demographics | Rating | Rank | Median Household Income |
| Immigrants | Moldova | 98.3 /100 | #101 | Exceptional $91,446 |
| Austrians | 98.2 /100 | #102 | Exceptional $91,339 |
| Immigrants | Ukraine | 98.0 /100 | #103 | Exceptional $91,124 |
| Immigrants | Kazakhstan | 97.8 /100 | #104 | Exceptional $91,015 |
| Immigrants | Brazil | 97.7 /100 | #105 | Exceptional $90,907 |
| Macedonians | 97.4 /100 | #106 | Exceptional $90,761 |
| Croatians | 97.3 /100 | #107 | Exceptional $90,685 |
| Zimbabweans | 97.2 /100 | #108 | Exceptional $90,618 |
| Chileans | 97.2 /100 | #109 | Exceptional $90,605 |
| Palestinians | 97.1 /100 | #110 | Exceptional $90,574 |
| Immigrants | Poland | 97.1 /100 | #111 | Exceptional $90,549 |
| Northern Europeans | 96.9 /100 | #112 | Exceptional $90,446 |
| Peruvians | 96.5 /100 | #113 | Exceptional $90,261 |
| Immigrants | Northern Africa | 95.9 /100 | #114 | Exceptional $90,026 |
| Immigrants | Western Asia | 95.9 /100 | #115 | Exceptional $90,005 |
Demographics Similar to Ecuadorians by Median Household Income
In terms of median household income, the demographic groups most similar to Ecuadorians are White/Caucasian ($82,029, a difference of 0.050%), Yugoslavian ($82,186, a difference of 0.14%), Vietnamese ($82,248, a difference of 0.22%), Panamanian ($82,272, a difference of 0.25%), and Nepalese ($82,410, a difference of 0.41%).
| Demographics | Rating | Rank | Median Household Income |
| Immigrants | Uruguay | 16.4 /100 | #210 | Poor $82,560 |
| Salvadorans | 15.4 /100 | #211 | Poor $82,449 |
| Venezuelans | 15.3 /100 | #212 | Poor $82,432 |
| Nepalese | 15.1 /100 | #213 | Poor $82,410 |
| Panamanians | 14.0 /100 | #214 | Poor $82,272 |
| Vietnamese | 13.8 /100 | #215 | Poor $82,248 |
| Yugoslavians | 13.3 /100 | #216 | Poor $82,186 |
| Ecuadorians | 12.5 /100 | #217 | Poor $82,070 |
| Whites/Caucasians | 12.2 /100 | #218 | Poor $82,029 |
| Nigerians | 10.3 /100 | #219 | Poor $81,725 |
| Immigrants | Venezuela | 9.0 /100 | #220 | Tragic $81,506 |
| Immigrants | Ghana | 9.0 /100 | #221 | Tragic $81,489 |
| Immigrants | Nigeria | 7.7 /100 | #222 | Tragic $81,236 |
| Immigrants | El Salvador | 7.6 /100 | #223 | Tragic $81,213 |
| Malaysians | 7.0 /100 | #224 | Tragic $81,064 |