Bermudan vs Chickasaw Median Female Earnings
COMPARE
Bermudan
Chickasaw
Median Female Earnings
Median Female Earnings Comparison
Bermudans
Chickasaw
$39,418
MEDIAN FEMALE EARNINGS
35.9/ 100
METRIC RATING
188th/ 347
METRIC RANK
$34,414
MEDIAN FEMALE EARNINGS
0.0/ 100
METRIC RATING
322nd/ 347
METRIC RANK
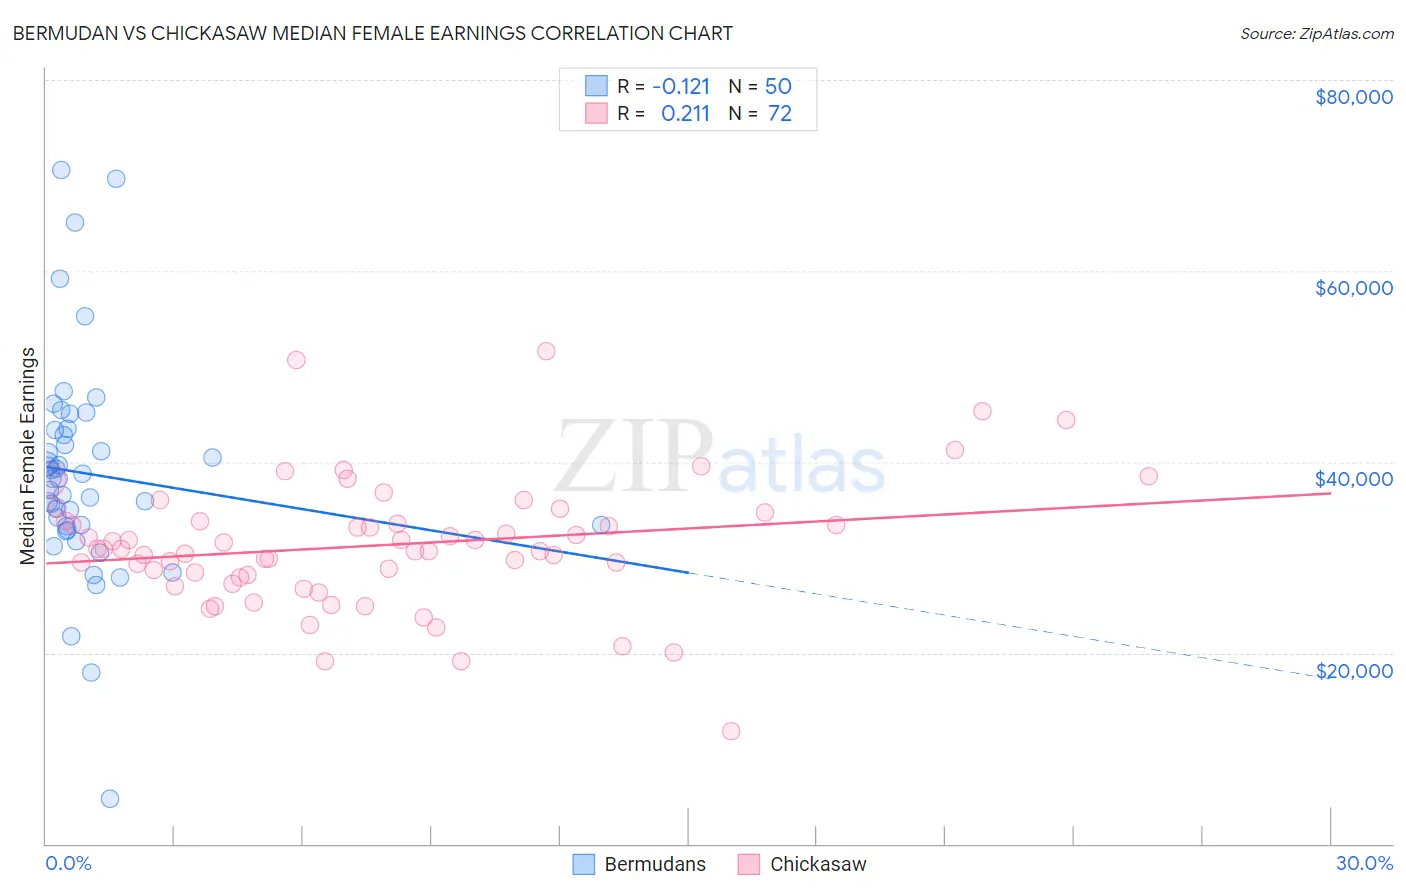
Bermudan vs Chickasaw Median Female Earnings Correlation Chart
The statistical analysis conducted on geographies consisting of 55,724,642 people shows a poor negative correlation between the proportion of Bermudans and median female earnings in the United States with a correlation coefficient (R) of -0.121 and weighted average of $39,418. Similarly, the statistical analysis conducted on geographies consisting of 147,680,530 people shows a weak positive correlation between the proportion of Chickasaw and median female earnings in the United States with a correlation coefficient (R) of 0.211 and weighted average of $34,414, a difference of 14.5%.
Median Female Earnings Correlation Summary
| Measurement | Bermudan | Chickasaw |
| Minimum | $4,682 | $11,797 |
| Maximum | $70,590 | $51,543 |
| Range | $65,908 | $39,746 |
| Mean | $38,764 | $31,266 |
| Median | $38,256 | $30,877 |
| Interquartile 25% (IQ1) | $33,240 | $28,026 |
| Interquartile 75% (IQ3) | $43,282 | $33,779 |
| Interquartile Range (IQR) | $10,042 | $5,753 |
| Standard Deviation (Sample) | $11,556 | $6,735 |
| Standard Deviation (Population) | $11,440 | $6,688 |
Similar Demographics by Median Female Earnings
Demographics Similar to Bermudans by Median Female Earnings
In terms of median female earnings, the demographic groups most similar to Bermudans are Swedish ($39,421, a difference of 0.010%), Colombian ($39,439, a difference of 0.050%), Immigrants from West Indies ($39,441, a difference of 0.060%), Senegalese ($39,384, a difference of 0.090%), and European ($39,457, a difference of 0.10%).
| Demographics | Rating | Rank | Median Female Earnings |
| Tsimshian | 41.4 /100 | #181 | Average $39,530 |
| Tlingit-Haida | 40.5 /100 | #182 | Average $39,513 |
| Hungarians | 40.3 /100 | #183 | Average $39,510 |
| Europeans | 37.7 /100 | #184 | Fair $39,457 |
| Immigrants | West Indies | 36.9 /100 | #185 | Fair $39,441 |
| Colombians | 36.9 /100 | #186 | Fair $39,439 |
| Swedes | 36.0 /100 | #187 | Fair $39,421 |
| Bermudans | 35.9 /100 | #188 | Fair $39,418 |
| Senegalese | 34.2 /100 | #189 | Fair $39,384 |
| Puget Sound Salish | 33.9 /100 | #190 | Fair $39,376 |
| Immigrants | Western Africa | 32.7 /100 | #191 | Fair $39,351 |
| Immigrants | Immigrants | 31.7 /100 | #192 | Fair $39,328 |
| Immigrants | Nigeria | 30.2 /100 | #193 | Fair $39,294 |
| Irish | 30.0 /100 | #194 | Fair $39,291 |
| Uruguayans | 27.3 /100 | #195 | Fair $39,228 |
Demographics Similar to Chickasaw by Median Female Earnings
In terms of median female earnings, the demographic groups most similar to Chickasaw are Hispanic or Latino ($34,421, a difference of 0.020%), Seminole ($34,385, a difference of 0.080%), Immigrants from Congo ($34,317, a difference of 0.28%), Immigrants from Honduras ($34,647, a difference of 0.68%), and Shoshone ($34,677, a difference of 0.76%).
| Demographics | Rating | Rank | Median Female Earnings |
| Pennsylvania Germans | 0.0 /100 | #315 | Tragic $34,802 |
| Cherokee | 0.0 /100 | #316 | Tragic $34,742 |
| Potawatomi | 0.0 /100 | #317 | Tragic $34,739 |
| Immigrants | Yemen | 0.0 /100 | #318 | Tragic $34,693 |
| Shoshone | 0.0 /100 | #319 | Tragic $34,677 |
| Immigrants | Honduras | 0.0 /100 | #320 | Tragic $34,647 |
| Hispanics or Latinos | 0.0 /100 | #321 | Tragic $34,421 |
| Chickasaw | 0.0 /100 | #322 | Tragic $34,414 |
| Seminole | 0.0 /100 | #323 | Tragic $34,385 |
| Immigrants | Congo | 0.0 /100 | #324 | Tragic $34,317 |
| Dutch West Indians | 0.0 /100 | #325 | Tragic $34,106 |
| Kiowa | 0.0 /100 | #326 | Tragic $34,074 |
| Cajuns | 0.0 /100 | #327 | Tragic $34,034 |
| Immigrants | Central America | 0.0 /100 | #328 | Tragic $33,953 |
| Hopi | 0.0 /100 | #329 | Tragic $33,932 |