Colville vs Iroquois Median Male Earnings
COMPARE
Colville
Iroquois
Median Male Earnings
Median Male Earnings Comparison
Colville
Iroquois
$48,516
MEDIAN MALE EARNINGS
0.3/ 100
METRIC RATING
274th/ 347
METRIC RANK
$49,374
MEDIAN MALE EARNINGS
0.7/ 100
METRIC RATING
260th/ 347
METRIC RANK
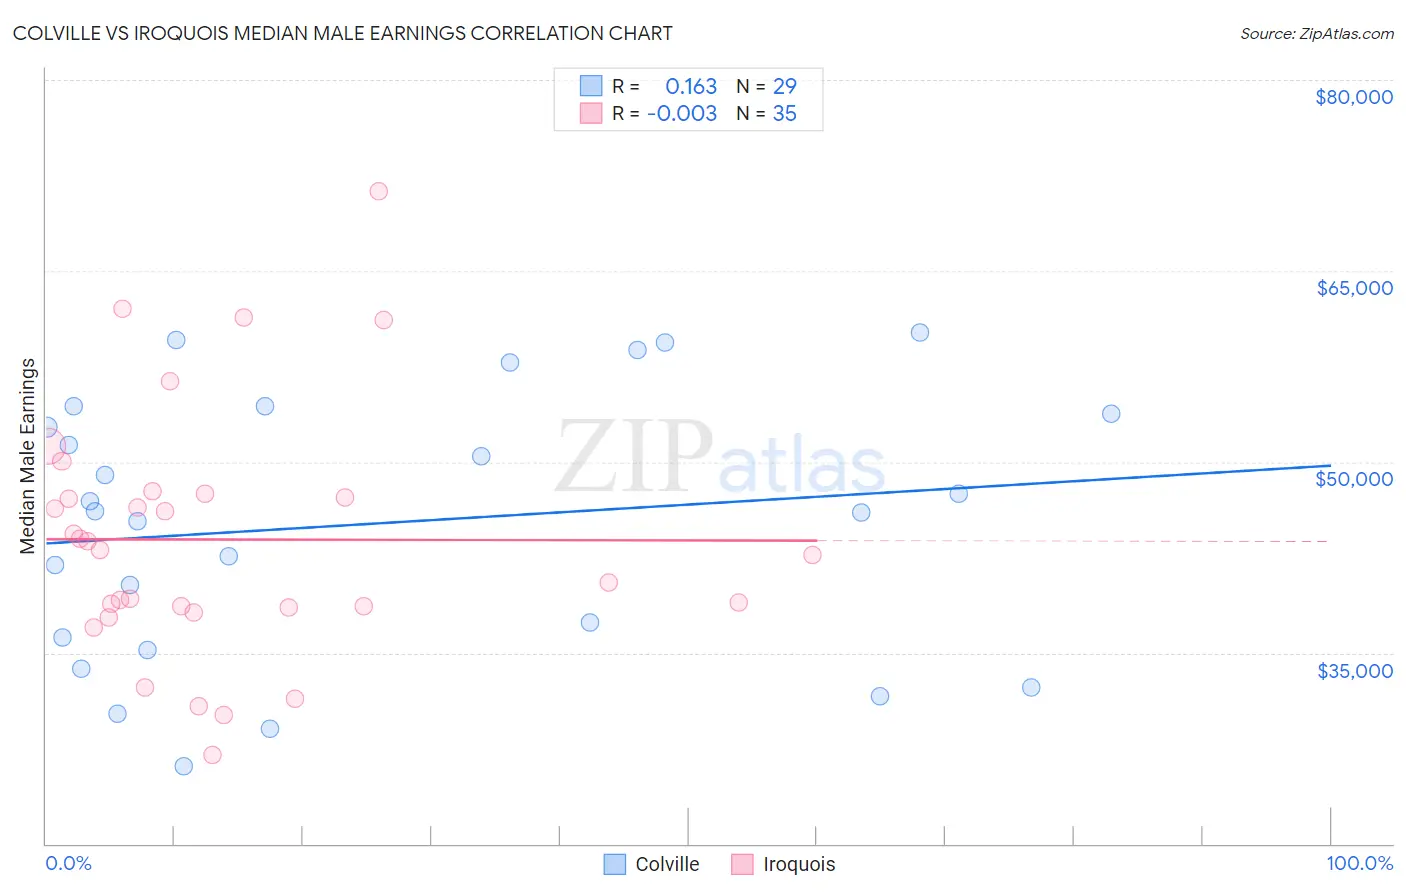
Colville vs Iroquois Median Male Earnings Correlation Chart
The statistical analysis conducted on geographies consisting of 34,680,141 people shows a poor positive correlation between the proportion of Colville and median male earnings in the United States with a correlation coefficient (R) of 0.163 and weighted average of $48,516. Similarly, the statistical analysis conducted on geographies consisting of 207,261,653 people shows no correlation between the proportion of Iroquois and median male earnings in the United States with a correlation coefficient (R) of -0.003 and weighted average of $49,374, a difference of 1.8%.
Median Male Earnings Correlation Summary
| Measurement | Colville | Iroquois |
| Minimum | $26,071 | $26,985 |
| Maximum | $60,184 | $71,281 |
| Range | $34,113 | $44,296 |
| Mean | $45,174 | $43,903 |
| Median | $46,167 | $43,033 |
| Interquartile 25% (IQ1) | $35,723 | $38,514 |
| Interquartile 75% (IQ3) | $54,047 | $47,481 |
| Interquartile Range (IQR) | $18,325 | $8,967 |
| Standard Deviation (Sample) | $10,311 | $9,773 |
| Standard Deviation (Population) | $10,132 | $9,632 |
Demographics Similar to Colville and Iroquois by Median Male Earnings
In terms of median male earnings, the demographic groups most similar to Colville are Immigrants from Somalia ($48,439, a difference of 0.16%), Jamaican ($48,632, a difference of 0.24%), Blackfeet ($48,402, a difference of 0.24%), Salvadoran ($48,646, a difference of 0.27%), and Cherokee ($48,669, a difference of 0.32%). Similarly, the demographic groups most similar to Iroquois are Liberian ($49,318, a difference of 0.11%), Nepalese ($49,458, a difference of 0.17%), Immigrants from West Indies ($49,271, a difference of 0.21%), Cree ($49,497, a difference of 0.25%), and Nicaraguan ($49,215, a difference of 0.32%).
| Demographics | Rating | Rank | Median Male Earnings |
| British West Indians | 0.8 /100 | #257 | Tragic $49,636 |
| Cree | 0.7 /100 | #258 | Tragic $49,497 |
| Nepalese | 0.7 /100 | #259 | Tragic $49,458 |
| Iroquois | 0.7 /100 | #260 | Tragic $49,374 |
| Liberians | 0.6 /100 | #261 | Tragic $49,318 |
| Immigrants | West Indies | 0.6 /100 | #262 | Tragic $49,271 |
| Nicaraguans | 0.6 /100 | #263 | Tragic $49,215 |
| Immigrants | Middle Africa | 0.6 /100 | #264 | Tragic $49,201 |
| Immigrants | Laos | 0.6 /100 | #265 | Tragic $49,190 |
| Somalis | 0.5 /100 | #266 | Tragic $49,025 |
| Spanish Americans | 0.5 /100 | #267 | Tragic $49,008 |
| Ute | 0.4 /100 | #268 | Tragic $48,899 |
| Tsimshian | 0.4 /100 | #269 | Tragic $48,836 |
| Potawatomi | 0.4 /100 | #270 | Tragic $48,768 |
| Cherokee | 0.3 /100 | #271 | Tragic $48,669 |
| Salvadorans | 0.3 /100 | #272 | Tragic $48,646 |
| Jamaicans | 0.3 /100 | #273 | Tragic $48,632 |
| Colville | 0.3 /100 | #274 | Tragic $48,516 |
| Immigrants | Somalia | 0.3 /100 | #275 | Tragic $48,439 |
| Blackfeet | 0.3 /100 | #276 | Tragic $48,402 |
| Belizeans | 0.2 /100 | #277 | Tragic $48,358 |