Portuguese vs Iroquois Median Male Earnings
COMPARE
Portuguese
Iroquois
Median Male Earnings
Median Male Earnings Comparison
Portuguese
Iroquois
$56,663
MEDIAN MALE EARNINGS
89.4/ 100
METRIC RATING
131st/ 347
METRIC RANK
$49,374
MEDIAN MALE EARNINGS
0.7/ 100
METRIC RATING
260th/ 347
METRIC RANK
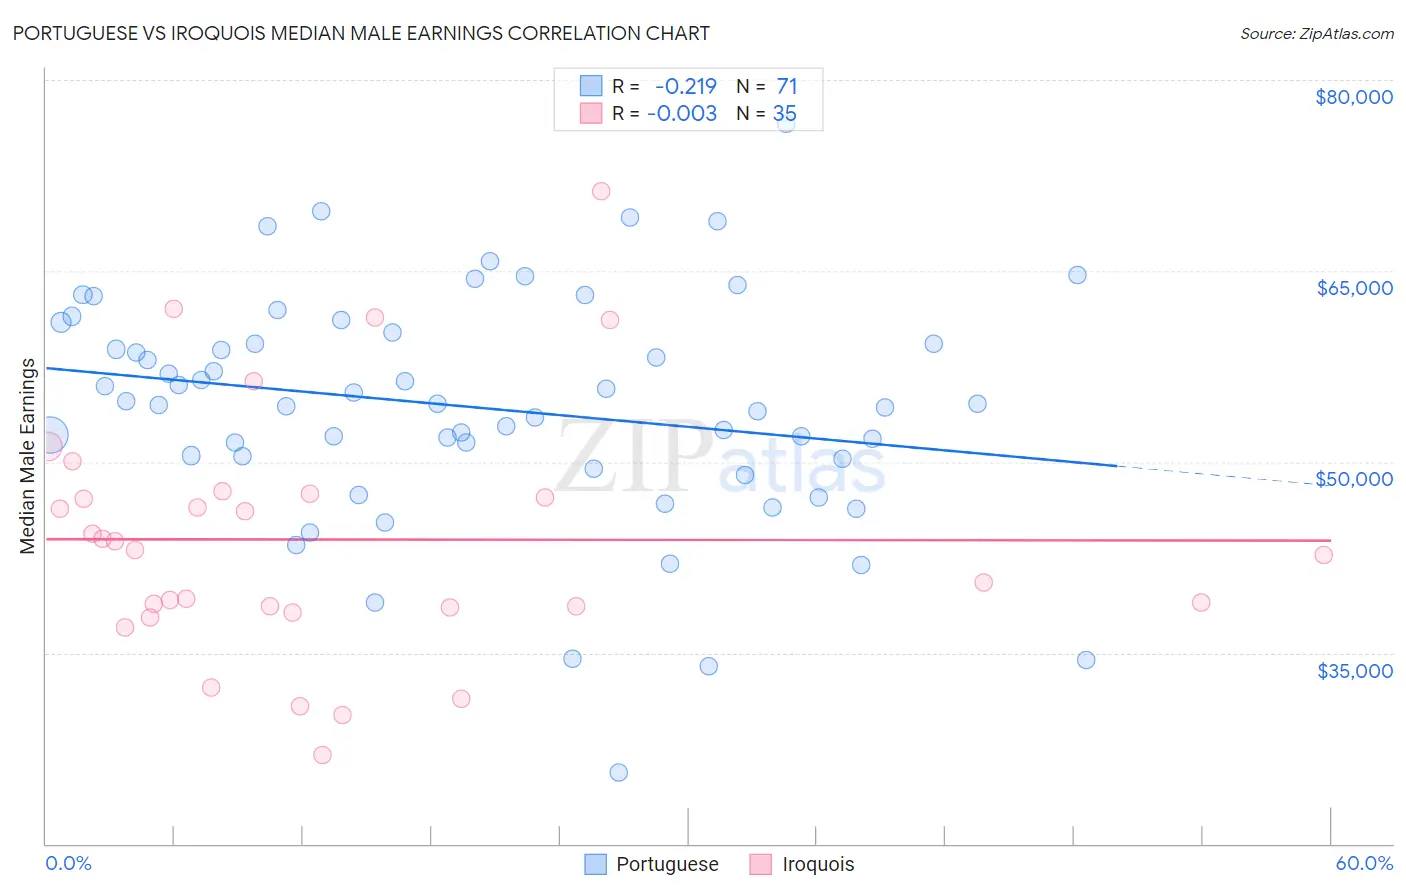
Portuguese vs Iroquois Median Male Earnings Correlation Chart
The statistical analysis conducted on geographies consisting of 450,078,327 people shows a weak negative correlation between the proportion of Portuguese and median male earnings in the United States with a correlation coefficient (R) of -0.219 and weighted average of $56,663. Similarly, the statistical analysis conducted on geographies consisting of 207,261,653 people shows no correlation between the proportion of Iroquois and median male earnings in the United States with a correlation coefficient (R) of -0.003 and weighted average of $49,374, a difference of 14.8%.
Median Male Earnings Correlation Summary
| Measurement | Portuguese | Iroquois |
| Minimum | $25,598 | $26,985 |
| Maximum | $76,528 | $71,281 |
| Range | $50,930 | $44,296 |
| Mean | $54,293 | $43,903 |
| Median | $54,519 | $43,033 |
| Interquartile 25% (IQ1) | $50,262 | $38,514 |
| Interquartile 75% (IQ3) | $60,181 | $47,481 |
| Interquartile Range (IQR) | $9,919 | $8,967 |
| Standard Deviation (Sample) | $9,132 | $9,773 |
| Standard Deviation (Population) | $9,067 | $9,632 |
Similar Demographics by Median Male Earnings
Demographics Similar to Portuguese by Median Male Earnings
In terms of median male earnings, the demographic groups most similar to Portuguese are Korean ($56,672, a difference of 0.020%), Pakistani ($56,719, a difference of 0.10%), Czech ($56,546, a difference of 0.21%), Immigrants from Germany ($56,542, a difference of 0.21%), and Immigrants from Syria ($56,830, a difference of 0.29%).
| Demographics | Rating | Rank | Median Male Earnings |
| Chileans | 91.9 /100 | #124 | Exceptional $56,973 |
| Immigrants | Morocco | 91.8 /100 | #125 | Exceptional $56,958 |
| Chinese | 91.1 /100 | #126 | Exceptional $56,872 |
| Brazilians | 90.9 /100 | #127 | Exceptional $56,837 |
| Immigrants | Syria | 90.8 /100 | #128 | Exceptional $56,830 |
| Pakistanis | 89.9 /100 | #129 | Excellent $56,719 |
| Koreans | 89.4 /100 | #130 | Excellent $56,672 |
| Portuguese | 89.4 /100 | #131 | Excellent $56,663 |
| Czechs | 88.2 /100 | #132 | Excellent $56,546 |
| Immigrants | Germany | 88.2 /100 | #133 | Excellent $56,542 |
| Moroccans | 87.7 /100 | #134 | Excellent $56,499 |
| Irish | 87.4 /100 | #135 | Excellent $56,464 |
| Immigrants | Saudi Arabia | 87.2 /100 | #136 | Excellent $56,452 |
| Slavs | 86.5 /100 | #137 | Excellent $56,390 |
| Slovaks | 85.5 /100 | #138 | Excellent $56,306 |
Demographics Similar to Iroquois by Median Male Earnings
In terms of median male earnings, the demographic groups most similar to Iroquois are Liberian ($49,318, a difference of 0.11%), Nepalese ($49,458, a difference of 0.17%), Immigrants from West Indies ($49,271, a difference of 0.21%), Cree ($49,497, a difference of 0.25%), and Nicaraguan ($49,215, a difference of 0.32%).
| Demographics | Rating | Rank | Median Male Earnings |
| German Russians | 1.1 /100 | #253 | Tragic $49,924 |
| Senegalese | 1.0 /100 | #254 | Tragic $49,774 |
| Alaskan Athabascans | 0.9 /100 | #255 | Tragic $49,748 |
| Alaska Natives | 0.9 /100 | #256 | Tragic $49,711 |
| British West Indians | 0.8 /100 | #257 | Tragic $49,636 |
| Cree | 0.7 /100 | #258 | Tragic $49,497 |
| Nepalese | 0.7 /100 | #259 | Tragic $49,458 |
| Iroquois | 0.7 /100 | #260 | Tragic $49,374 |
| Liberians | 0.6 /100 | #261 | Tragic $49,318 |
| Immigrants | West Indies | 0.6 /100 | #262 | Tragic $49,271 |
| Nicaraguans | 0.6 /100 | #263 | Tragic $49,215 |
| Immigrants | Middle Africa | 0.6 /100 | #264 | Tragic $49,201 |
| Immigrants | Laos | 0.6 /100 | #265 | Tragic $49,190 |
| Somalis | 0.5 /100 | #266 | Tragic $49,025 |
| Spanish Americans | 0.5 /100 | #267 | Tragic $49,008 |