Salvadoran vs Pakistani Householder Income Ages 45 - 64 years
COMPARE
Salvadoran
Pakistani
Householder Income Ages 45 - 64 years
Householder Income Ages 45 - 64 years Comparison
Salvadorans
Pakistanis
$94,842
HOUSEHOLDER INCOME AGES 45 - 64 YEARS
6.0/ 100
METRIC RATING
220th/ 347
METRIC RANK
$105,317
HOUSEHOLDER INCOME AGES 45 - 64 YEARS
92.4/ 100
METRIC RATING
125th/ 347
METRIC RANK
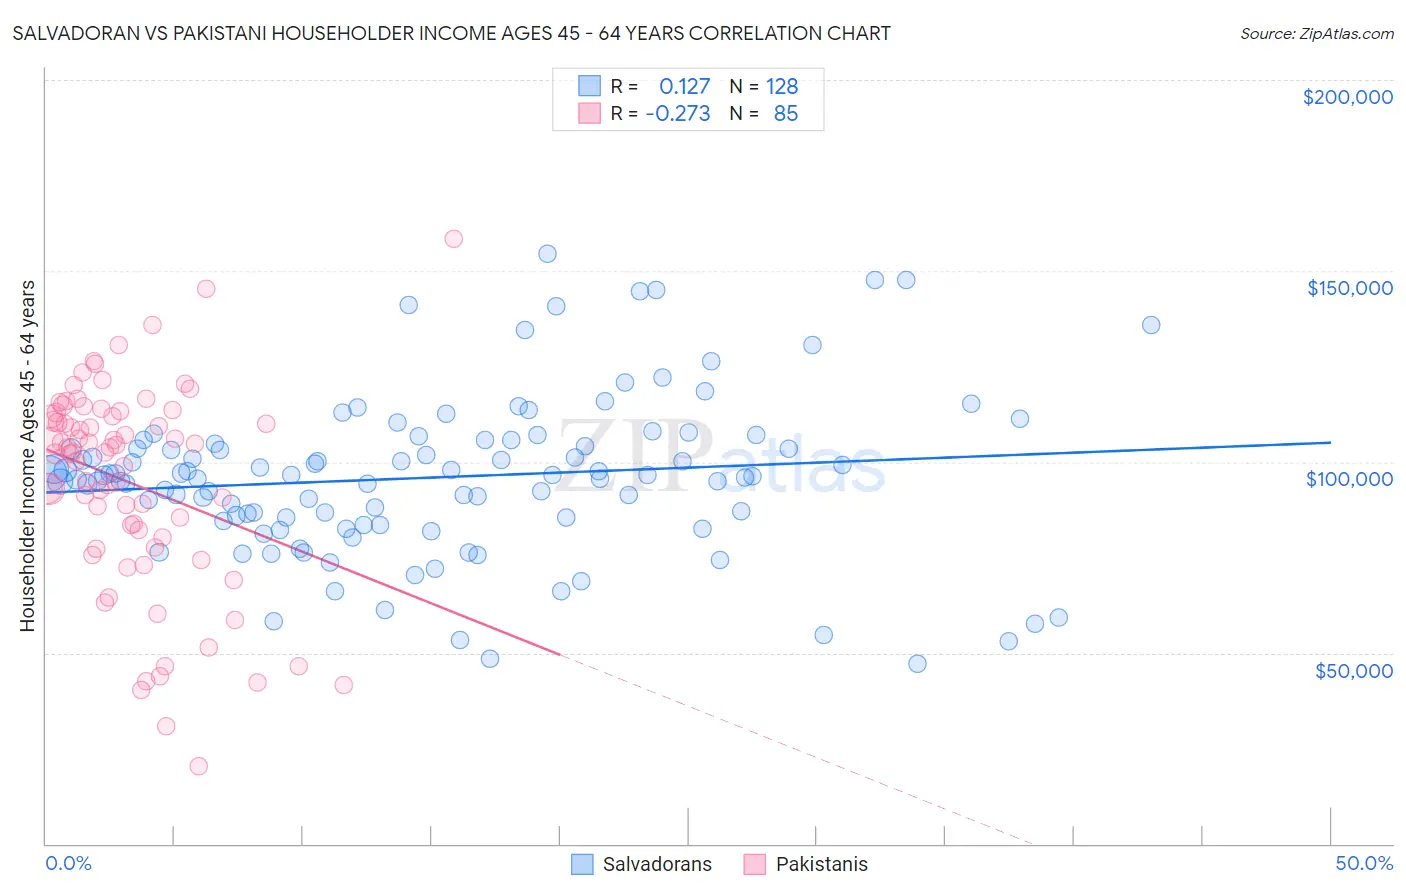
Salvadoran vs Pakistani Householder Income Ages 45 - 64 years Correlation Chart
The statistical analysis conducted on geographies consisting of 398,191,339 people shows a poor positive correlation between the proportion of Salvadorans and household income with householder between the ages 45 and 64 in the United States with a correlation coefficient (R) of 0.127 and weighted average of $94,842. Similarly, the statistical analysis conducted on geographies consisting of 334,898,404 people shows a weak negative correlation between the proportion of Pakistanis and household income with householder between the ages 45 and 64 in the United States with a correlation coefficient (R) of -0.273 and weighted average of $105,317, a difference of 11.0%.
Householder Income Ages 45 - 64 years Correlation Summary
| Measurement | Salvadoran | Pakistani |
| Minimum | $47,083 | $20,167 |
| Maximum | $154,565 | $158,417 |
| Range | $107,482 | $138,250 |
| Mean | $95,925 | $94,559 |
| Median | $96,593 | $102,574 |
| Interquartile 25% (IQ1) | $84,940 | $78,855 |
| Interquartile 75% (IQ3) | $105,324 | $112,512 |
| Interquartile Range (IQR) | $20,384 | $33,657 |
| Standard Deviation (Sample) | $20,754 | $26,997 |
| Standard Deviation (Population) | $20,673 | $26,838 |
Similar Demographics by Householder Income Ages 45 - 64 years
Demographics Similar to Salvadorans by Householder Income Ages 45 - 64 years
In terms of householder income ages 45 - 64 years, the demographic groups most similar to Salvadorans are Immigrants from Armenia ($94,863, a difference of 0.020%), Immigrants from Nigeria ($94,804, a difference of 0.040%), Delaware ($94,914, a difference of 0.080%), Immigrants from Ghana ($94,982, a difference of 0.15%), and Malaysian ($94,517, a difference of 0.34%).
| Demographics | Rating | Rank | Householder Income Ages 45 - 64 years |
| Immigrants | Uruguay | 10.7 /100 | #213 | Poor $96,086 |
| Panamanians | 10.6 /100 | #214 | Poor $96,066 |
| Nigerians | 8.2 /100 | #215 | Tragic $95,492 |
| Immigrants | Venezuela | 7.6 /100 | #216 | Tragic $95,342 |
| Immigrants | Ghana | 6.4 /100 | #217 | Tragic $94,982 |
| Delaware | 6.2 /100 | #218 | Tragic $94,914 |
| Immigrants | Armenia | 6.1 /100 | #219 | Tragic $94,863 |
| Salvadorans | 6.0 /100 | #220 | Tragic $94,842 |
| Immigrants | Nigeria | 5.9 /100 | #221 | Tragic $94,804 |
| Malaysians | 5.2 /100 | #222 | Tragic $94,517 |
| Immigrants | Nonimmigrants | 5.0 /100 | #223 | Tragic $94,448 |
| Immigrants | Bosnia and Herzegovina | 4.6 /100 | #224 | Tragic $94,288 |
| Bermudans | 4.4 /100 | #225 | Tragic $94,197 |
| Immigrants | Azores | 4.3 /100 | #226 | Tragic $94,138 |
| Alaska Natives | 4.0 /100 | #227 | Tragic $93,991 |
Demographics Similar to Pakistanis by Householder Income Ages 45 - 64 years
In terms of householder income ages 45 - 64 years, the demographic groups most similar to Pakistanis are Portuguese ($105,309, a difference of 0.010%), Immigrants from Saudi Arabia ($105,249, a difference of 0.060%), Immigrants from Northern Africa ($105,430, a difference of 0.11%), Native Hawaiian ($105,149, a difference of 0.16%), and Peruvian ($105,070, a difference of 0.23%).
| Demographics | Rating | Rank | Householder Income Ages 45 - 64 years |
| Immigrants | Western Asia | 95.0 /100 | #118 | Exceptional $106,217 |
| Immigrants | Jordan | 94.9 /100 | #119 | Exceptional $106,164 |
| Immigrants | South Eastern Asia | 94.8 /100 | #120 | Exceptional $106,109 |
| Poles | 94.4 /100 | #121 | Exceptional $105,952 |
| Immigrants | North Macedonia | 94.2 /100 | #122 | Exceptional $105,892 |
| Danes | 93.4 /100 | #123 | Exceptional $105,619 |
| Immigrants | Northern Africa | 92.8 /100 | #124 | Exceptional $105,430 |
| Pakistanis | 92.4 /100 | #125 | Exceptional $105,317 |
| Portuguese | 92.4 /100 | #126 | Exceptional $105,309 |
| Immigrants | Saudi Arabia | 92.2 /100 | #127 | Exceptional $105,249 |
| Native Hawaiians | 91.8 /100 | #128 | Exceptional $105,149 |
| Peruvians | 91.5 /100 | #129 | Exceptional $105,070 |
| Immigrants | Zimbabwe | 91.2 /100 | #130 | Exceptional $104,992 |
| Immigrants | Syria | 90.7 /100 | #131 | Exceptional $104,858 |
| Lebanese | 90.1 /100 | #132 | Exceptional $104,734 |