Yuman vs Central American Indian Householder Income Ages 45 - 64 years
COMPARE
Yuman
Central American Indian
Householder Income Ages 45 - 64 years
Householder Income Ages 45 - 64 years Comparison
Yuman
Central American Indians
$82,139
HOUSEHOLDER INCOME AGES 45 - 64 YEARS
0.0/ 100
METRIC RATING
321st/ 347
METRIC RANK
$86,764
HOUSEHOLDER INCOME AGES 45 - 64 YEARS
0.1/ 100
METRIC RATING
284th/ 347
METRIC RANK
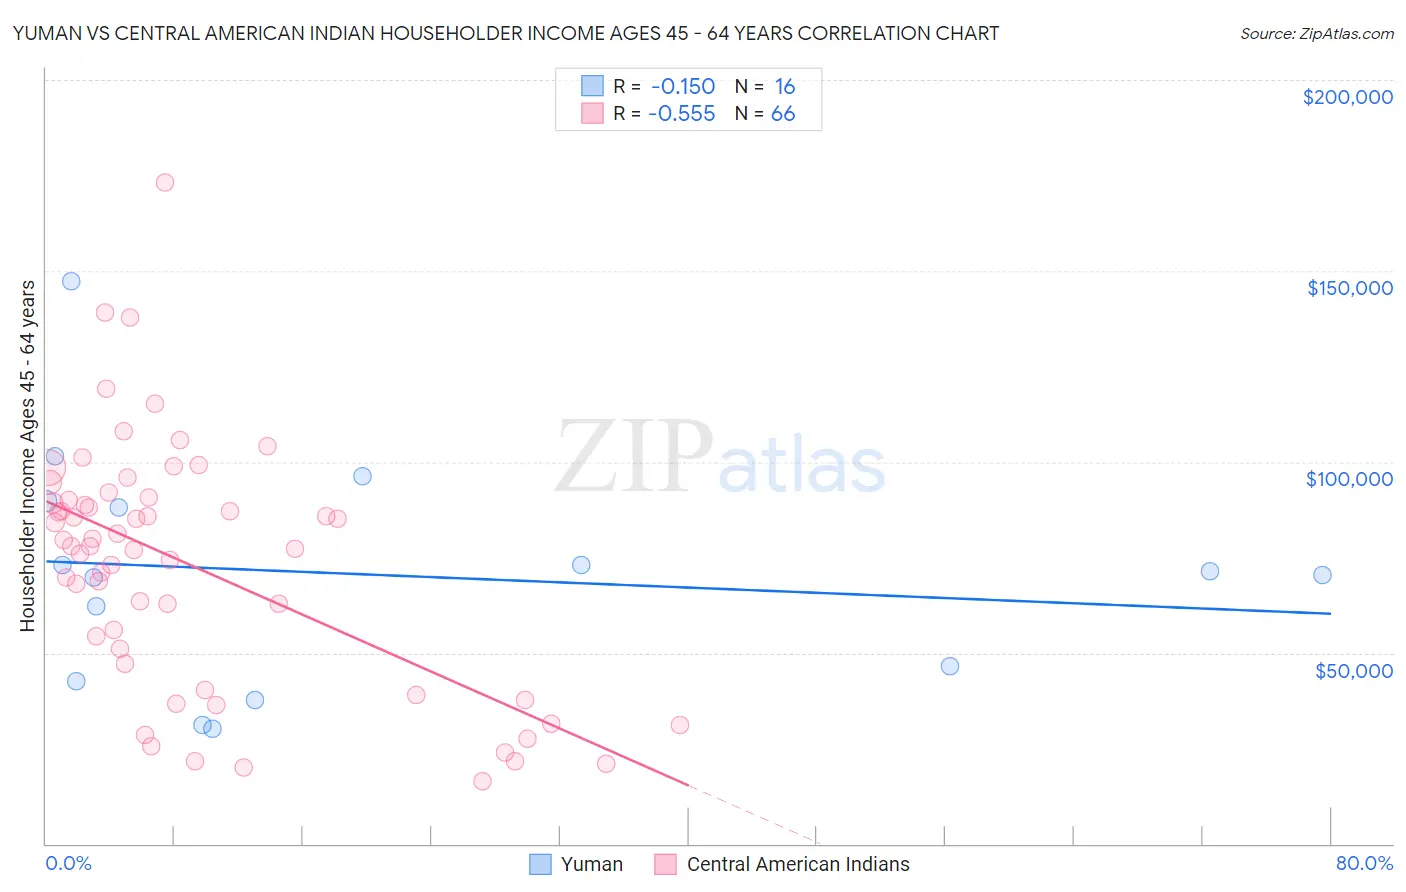
Yuman vs Central American Indian Householder Income Ages 45 - 64 years Correlation Chart
The statistical analysis conducted on geographies consisting of 40,638,161 people shows a poor negative correlation between the proportion of Yuman and household income with householder between the ages 45 and 64 in the United States with a correlation coefficient (R) of -0.150 and weighted average of $82,139. Similarly, the statistical analysis conducted on geographies consisting of 325,794,243 people shows a substantial negative correlation between the proportion of Central American Indians and household income with householder between the ages 45 and 64 in the United States with a correlation coefficient (R) of -0.555 and weighted average of $86,764, a difference of 5.6%.
Householder Income Ages 45 - 64 years Correlation Summary
| Measurement | Yuman | Central American Indian |
| Minimum | $30,086 | $16,412 |
| Maximum | $147,152 | $173,000 |
| Range | $117,066 | $156,588 |
| Mean | $70,628 | $72,864 |
| Median | $70,888 | $78,027 |
| Interquartile 25% (IQ1) | $44,573 | $47,059 |
| Interquartile 75% (IQ3) | $88,954 | $90,095 |
| Interquartile Range (IQR) | $44,381 | $43,036 |
| Standard Deviation (Sample) | $30,431 | $32,226 |
| Standard Deviation (Population) | $29,465 | $31,981 |
Similar Demographics by Householder Income Ages 45 - 64 years
Demographics Similar to Yuman by Householder Income Ages 45 - 64 years
In terms of householder income ages 45 - 64 years, the demographic groups most similar to Yuman are Apache ($82,184, a difference of 0.050%), Chickasaw ($82,193, a difference of 0.070%), Choctaw ($82,287, a difference of 0.18%), Colville ($82,474, a difference of 0.41%), and Immigrants from Caribbean ($82,513, a difference of 0.46%).
| Demographics | Rating | Rank | Householder Income Ages 45 - 64 years |
| Immigrants | Honduras | 0.0 /100 | #314 | Tragic $82,697 |
| Paiute | 0.0 /100 | #315 | Tragic $82,629 |
| Immigrants | Caribbean | 0.0 /100 | #316 | Tragic $82,513 |
| Colville | 0.0 /100 | #317 | Tragic $82,474 |
| Choctaw | 0.0 /100 | #318 | Tragic $82,287 |
| Chickasaw | 0.0 /100 | #319 | Tragic $82,193 |
| Apache | 0.0 /100 | #320 | Tragic $82,184 |
| Yuman | 0.0 /100 | #321 | Tragic $82,139 |
| Sioux | 0.0 /100 | #322 | Tragic $81,750 |
| Bahamians | 0.0 /100 | #323 | Tragic $81,369 |
| Yup'ik | 0.0 /100 | #324 | Tragic $81,000 |
| Immigrants | Cuba | 0.0 /100 | #325 | Tragic $80,662 |
| Dominicans | 0.0 /100 | #326 | Tragic $80,623 |
| Seminole | 0.0 /100 | #327 | Tragic $80,077 |
| Natives/Alaskans | 0.0 /100 | #328 | Tragic $79,816 |
Demographics Similar to Central American Indians by Householder Income Ages 45 - 64 years
In terms of householder income ages 45 - 64 years, the demographic groups most similar to Central American Indians are Mexican ($86,816, a difference of 0.060%), Senegalese ($86,897, a difference of 0.15%), Yaqui ($86,914, a difference of 0.17%), Blackfeet ($86,595, a difference of 0.20%), and Immigrants from Guatemala ($86,573, a difference of 0.22%).
| Demographics | Rating | Rank | Householder Income Ages 45 - 64 years |
| Cree | 0.1 /100 | #277 | Tragic $87,185 |
| Immigrants | Jamaica | 0.1 /100 | #278 | Tragic $87,035 |
| Yakama | 0.1 /100 | #279 | Tragic $86,992 |
| Immigrants | Somalia | 0.1 /100 | #280 | Tragic $86,987 |
| Yaqui | 0.1 /100 | #281 | Tragic $86,914 |
| Senegalese | 0.1 /100 | #282 | Tragic $86,897 |
| Mexicans | 0.1 /100 | #283 | Tragic $86,816 |
| Central American Indians | 0.1 /100 | #284 | Tragic $86,764 |
| Blackfeet | 0.1 /100 | #285 | Tragic $86,595 |
| Immigrants | Guatemala | 0.1 /100 | #286 | Tragic $86,573 |
| Bangladeshis | 0.1 /100 | #287 | Tragic $86,402 |
| Immigrants | St. Vincent and the Grenadines | 0.1 /100 | #288 | Tragic $86,394 |
| Cubans | 0.1 /100 | #289 | Tragic $86,301 |
| Cherokee | 0.1 /100 | #290 | Tragic $86,125 |
| Hispanics or Latinos | 0.1 /100 | #291 | Tragic $86,006 |