Immigrants from Argentina vs Pakistani Householder Income Ages 45 - 64 years
COMPARE
Immigrants from Argentina
Pakistani
Householder Income Ages 45 - 64 years
Householder Income Ages 45 - 64 years Comparison
Immigrants from Argentina
Pakistanis
$108,264
HOUSEHOLDER INCOME AGES 45 - 64 YEARS
98.2/ 100
METRIC RATING
96th/ 347
METRIC RANK
$105,317
HOUSEHOLDER INCOME AGES 45 - 64 YEARS
92.4/ 100
METRIC RATING
125th/ 347
METRIC RANK
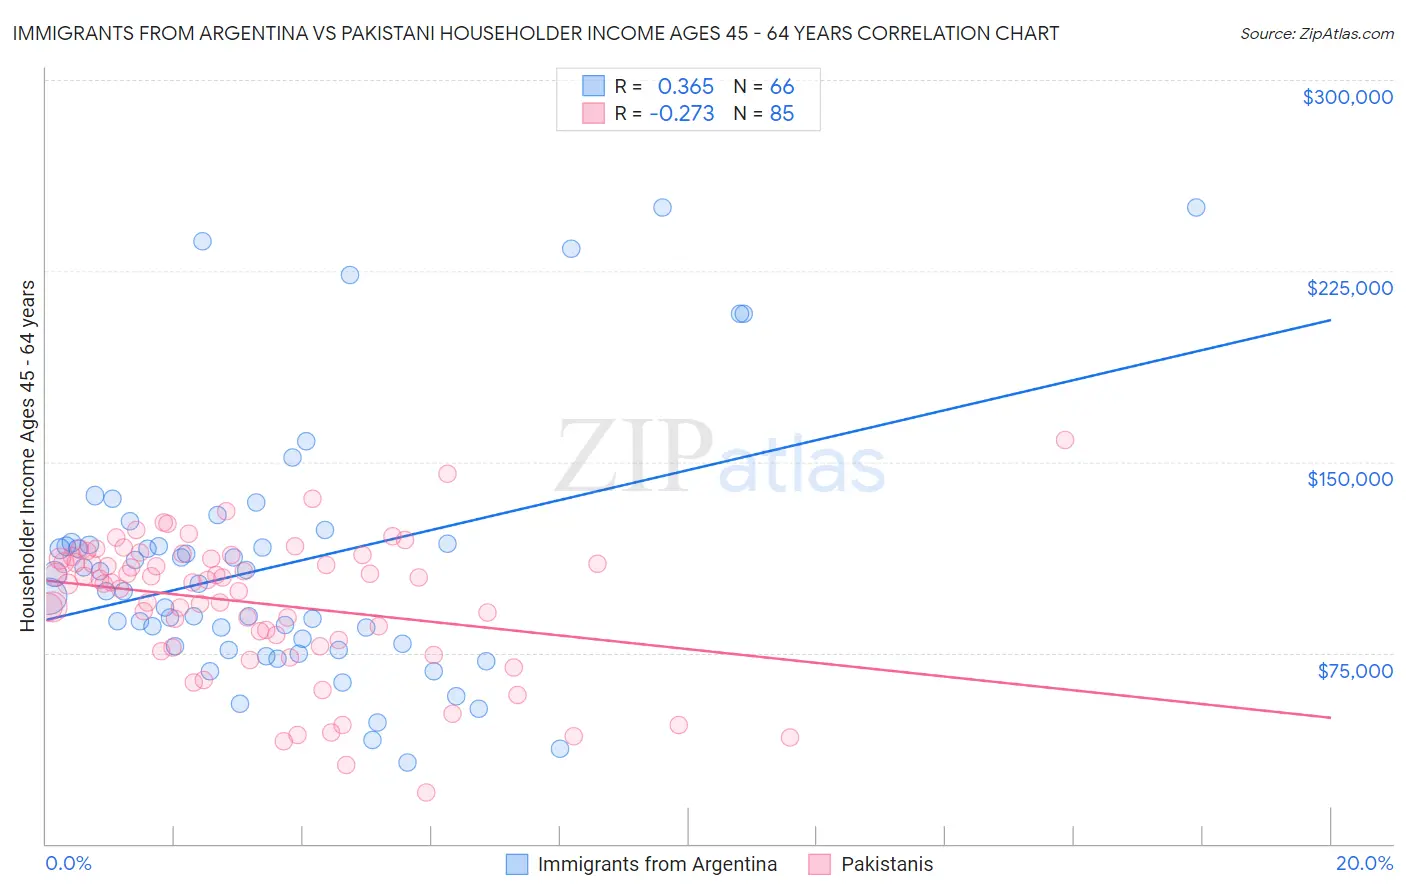
Immigrants from Argentina vs Pakistani Householder Income Ages 45 - 64 years Correlation Chart
The statistical analysis conducted on geographies consisting of 264,240,865 people shows a mild positive correlation between the proportion of Immigrants from Argentina and household income with householder between the ages 45 and 64 in the United States with a correlation coefficient (R) of 0.365 and weighted average of $108,264. Similarly, the statistical analysis conducted on geographies consisting of 334,898,404 people shows a weak negative correlation between the proportion of Pakistanis and household income with householder between the ages 45 and 64 in the United States with a correlation coefficient (R) of -0.273 and weighted average of $105,317, a difference of 2.8%.
Householder Income Ages 45 - 64 years Correlation Summary
| Measurement | Immigrants from Argentina | Pakistani |
| Minimum | $31,738 | $20,167 |
| Maximum | $250,001 | $158,417 |
| Range | $218,263 | $138,250 |
| Mean | $109,127 | $94,559 |
| Median | $100,704 | $102,574 |
| Interquartile 25% (IQ1) | $77,665 | $78,855 |
| Interquartile 75% (IQ3) | $117,604 | $112,512 |
| Interquartile Range (IQR) | $39,939 | $33,657 |
| Standard Deviation (Sample) | $49,794 | $26,997 |
| Standard Deviation (Population) | $49,415 | $26,838 |
Similar Demographics by Householder Income Ages 45 - 64 years
Demographics Similar to Immigrants from Argentina by Householder Income Ages 45 - 64 years
In terms of householder income ages 45 - 64 years, the demographic groups most similar to Immigrants from Argentina are Immigrants from Hungary ($108,267, a difference of 0.0%), Sri Lankan ($108,270, a difference of 0.010%), Immigrants from Croatia ($108,304, a difference of 0.040%), Croatian ($108,383, a difference of 0.11%), and Ukrainian ($108,475, a difference of 0.19%).
| Demographics | Rating | Rank | Householder Income Ages 45 - 64 years |
| Ukrainians | 98.3 /100 | #89 | Exceptional $108,475 |
| Immigrants | Philippines | 98.3 /100 | #90 | Exceptional $108,471 |
| Immigrants | Lebanon | 98.3 /100 | #91 | Exceptional $108,471 |
| Croatians | 98.3 /100 | #92 | Exceptional $108,383 |
| Immigrants | Croatia | 98.2 /100 | #93 | Exceptional $108,304 |
| Sri Lankans | 98.2 /100 | #94 | Exceptional $108,270 |
| Immigrants | Hungary | 98.2 /100 | #95 | Exceptional $108,267 |
| Immigrants | Argentina | 98.2 /100 | #96 | Exceptional $108,264 |
| Northern Europeans | 97.8 /100 | #97 | Exceptional $107,870 |
| Immigrants | Southern Europe | 97.7 /100 | #98 | Exceptional $107,775 |
| Palestinians | 97.6 /100 | #99 | Exceptional $107,721 |
| Immigrants | Serbia | 97.4 /100 | #100 | Exceptional $107,569 |
| Immigrants | Kazakhstan | 97.2 /100 | #101 | Exceptional $107,378 |
| Immigrants | Moldova | 97.1 /100 | #102 | Exceptional $107,357 |
| Syrians | 96.9 /100 | #103 | Exceptional $107,207 |
Demographics Similar to Pakistanis by Householder Income Ages 45 - 64 years
In terms of householder income ages 45 - 64 years, the demographic groups most similar to Pakistanis are Portuguese ($105,309, a difference of 0.010%), Immigrants from Saudi Arabia ($105,249, a difference of 0.060%), Immigrants from Northern Africa ($105,430, a difference of 0.11%), Native Hawaiian ($105,149, a difference of 0.16%), and Peruvian ($105,070, a difference of 0.23%).
| Demographics | Rating | Rank | Householder Income Ages 45 - 64 years |
| Immigrants | Western Asia | 95.0 /100 | #118 | Exceptional $106,217 |
| Immigrants | Jordan | 94.9 /100 | #119 | Exceptional $106,164 |
| Immigrants | South Eastern Asia | 94.8 /100 | #120 | Exceptional $106,109 |
| Poles | 94.4 /100 | #121 | Exceptional $105,952 |
| Immigrants | North Macedonia | 94.2 /100 | #122 | Exceptional $105,892 |
| Danes | 93.4 /100 | #123 | Exceptional $105,619 |
| Immigrants | Northern Africa | 92.8 /100 | #124 | Exceptional $105,430 |
| Pakistanis | 92.4 /100 | #125 | Exceptional $105,317 |
| Portuguese | 92.4 /100 | #126 | Exceptional $105,309 |
| Immigrants | Saudi Arabia | 92.2 /100 | #127 | Exceptional $105,249 |
| Native Hawaiians | 91.8 /100 | #128 | Exceptional $105,149 |
| Peruvians | 91.5 /100 | #129 | Exceptional $105,070 |
| Immigrants | Zimbabwe | 91.2 /100 | #130 | Exceptional $104,992 |
| Immigrants | Syria | 90.7 /100 | #131 | Exceptional $104,858 |
| Lebanese | 90.1 /100 | #132 | Exceptional $104,734 |