Yuman vs Kiowa Householder Income Ages 45 - 64 years
COMPARE
Yuman
Kiowa
Householder Income Ages 45 - 64 years
Householder Income Ages 45 - 64 years Comparison
Yuman
Kiowa
$82,139
HOUSEHOLDER INCOME AGES 45 - 64 YEARS
0.0/ 100
METRIC RATING
321st/ 347
METRIC RANK
$74,815
HOUSEHOLDER INCOME AGES 45 - 64 YEARS
0.0/ 100
METRIC RATING
339th/ 347
METRIC RANK
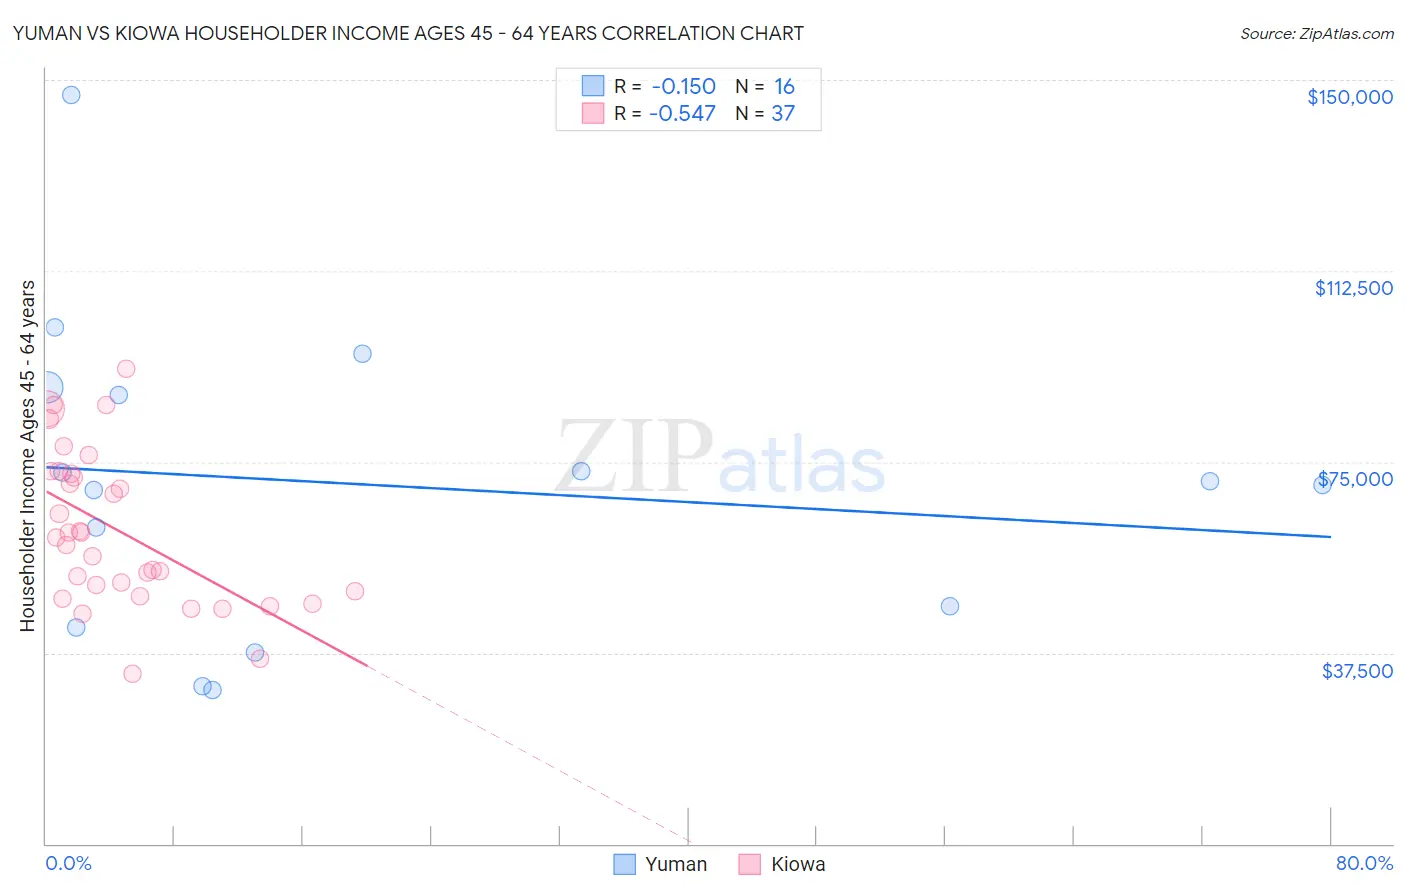
Yuman vs Kiowa Householder Income Ages 45 - 64 years Correlation Chart
The statistical analysis conducted on geographies consisting of 40,638,161 people shows a poor negative correlation between the proportion of Yuman and household income with householder between the ages 45 and 64 in the United States with a correlation coefficient (R) of -0.150 and weighted average of $82,139. Similarly, the statistical analysis conducted on geographies consisting of 56,088,586 people shows a substantial negative correlation between the proportion of Kiowa and household income with householder between the ages 45 and 64 in the United States with a correlation coefficient (R) of -0.547 and weighted average of $74,815, a difference of 9.8%.
Householder Income Ages 45 - 64 years Correlation Summary
| Measurement | Yuman | Kiowa |
| Minimum | $30,086 | $33,438 |
| Maximum | $147,152 | $93,403 |
| Range | $117,066 | $59,965 |
| Mean | $70,628 | $61,508 |
| Median | $70,888 | $60,248 |
| Interquartile 25% (IQ1) | $44,573 | $49,045 |
| Interquartile 75% (IQ3) | $88,954 | $72,863 |
| Interquartile Range (IQR) | $44,381 | $23,818 |
| Standard Deviation (Sample) | $30,431 | $15,003 |
| Standard Deviation (Population) | $29,465 | $14,798 |
Demographics Similar to Yuman and Kiowa by Householder Income Ages 45 - 64 years
In terms of householder income ages 45 - 64 years, the demographic groups most similar to Yuman are Apache ($82,184, a difference of 0.050%), Sioux ($81,750, a difference of 0.48%), Bahamian ($81,369, a difference of 0.95%), Yup'ik ($81,000, a difference of 1.4%), and Immigrants from Cuba ($80,662, a difference of 1.8%). Similarly, the demographic groups most similar to Kiowa are Immigrants from Yemen ($74,575, a difference of 0.32%), Hopi ($75,562, a difference of 1.0%), Pueblo ($75,601, a difference of 1.1%), Arapaho ($75,945, a difference of 1.5%), and Cheyenne ($76,362, a difference of 2.1%).
| Demographics | Rating | Rank | Householder Income Ages 45 - 64 years |
| Apache | 0.0 /100 | #320 | Tragic $82,184 |
| Yuman | 0.0 /100 | #321 | Tragic $82,139 |
| Sioux | 0.0 /100 | #322 | Tragic $81,750 |
| Bahamians | 0.0 /100 | #323 | Tragic $81,369 |
| Yup'ik | 0.0 /100 | #324 | Tragic $81,000 |
| Immigrants | Cuba | 0.0 /100 | #325 | Tragic $80,662 |
| Dominicans | 0.0 /100 | #326 | Tragic $80,623 |
| Seminole | 0.0 /100 | #327 | Tragic $80,077 |
| Natives/Alaskans | 0.0 /100 | #328 | Tragic $79,816 |
| Dutch West Indians | 0.0 /100 | #329 | Tragic $79,171 |
| Creek | 0.0 /100 | #330 | Tragic $78,960 |
| Immigrants | Dominican Republic | 0.0 /100 | #331 | Tragic $78,836 |
| Blacks/African Americans | 0.0 /100 | #332 | Tragic $78,556 |
| Immigrants | Congo | 0.0 /100 | #333 | Tragic $77,850 |
| Menominee | 0.0 /100 | #334 | Tragic $76,903 |
| Cheyenne | 0.0 /100 | #335 | Tragic $76,362 |
| Arapaho | 0.0 /100 | #336 | Tragic $75,945 |
| Pueblo | 0.0 /100 | #337 | Tragic $75,601 |
| Hopi | 0.0 /100 | #338 | Tragic $75,562 |
| Kiowa | 0.0 /100 | #339 | Tragic $74,815 |
| Immigrants | Yemen | 0.0 /100 | #340 | Tragic $74,575 |