Yuman vs Immigrants from Poland Householder Income Ages 45 - 64 years
COMPARE
Yuman
Immigrants from Poland
Householder Income Ages 45 - 64 years
Householder Income Ages 45 - 64 years Comparison
Yuman
Immigrants from Poland
$82,139
HOUSEHOLDER INCOME AGES 45 - 64 YEARS
0.0/ 100
METRIC RATING
321st/ 347
METRIC RANK
$106,319
HOUSEHOLDER INCOME AGES 45 - 64 YEARS
95.3/ 100
METRIC RATING
114th/ 347
METRIC RANK
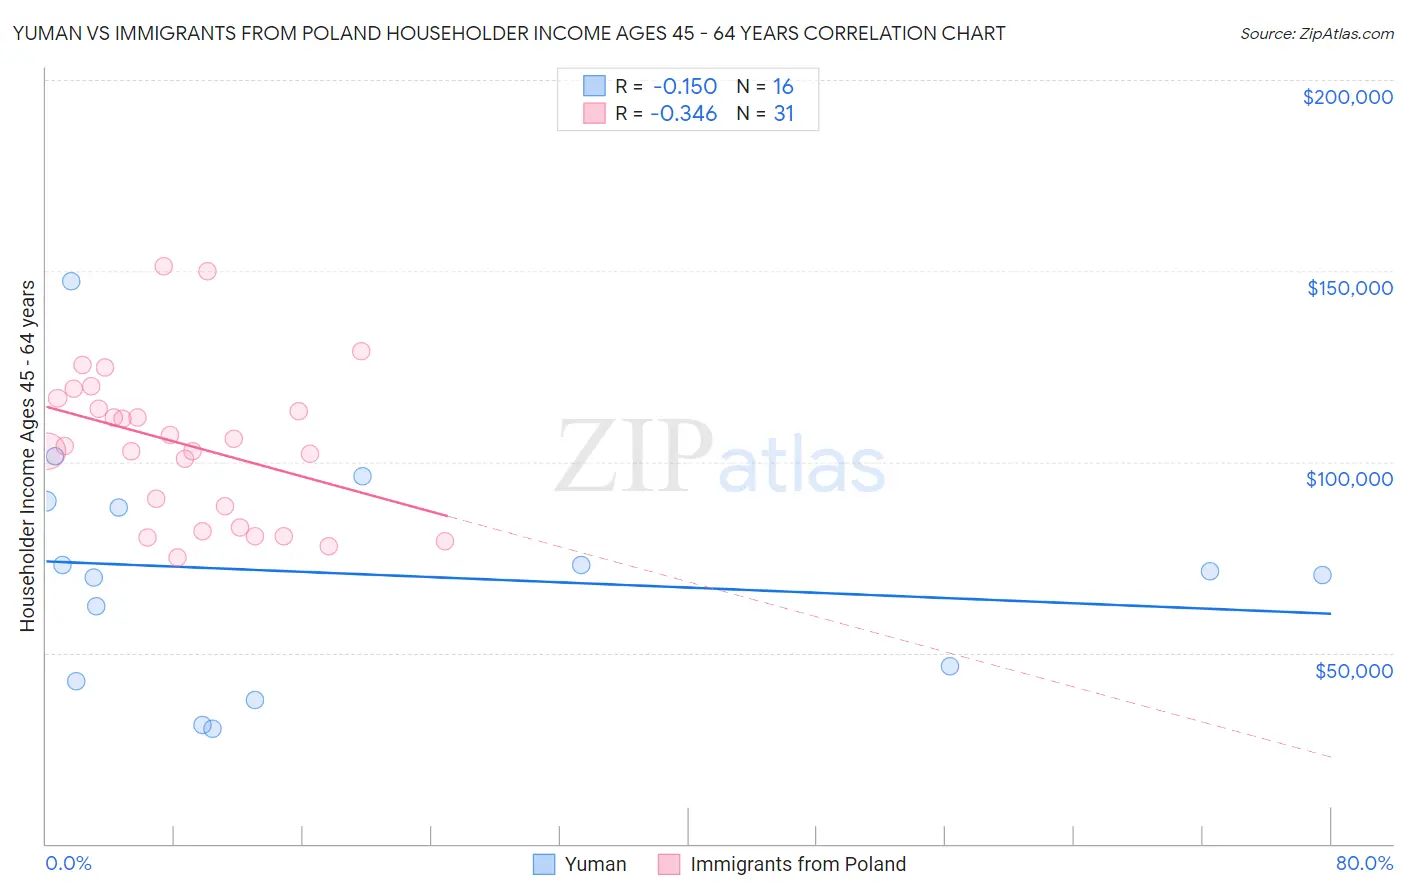
Yuman vs Immigrants from Poland Householder Income Ages 45 - 64 years Correlation Chart
The statistical analysis conducted on geographies consisting of 40,638,161 people shows a poor negative correlation between the proportion of Yuman and household income with householder between the ages 45 and 64 in the United States with a correlation coefficient (R) of -0.150 and weighted average of $82,139. Similarly, the statistical analysis conducted on geographies consisting of 304,578,268 people shows a mild negative correlation between the proportion of Immigrants from Poland and household income with householder between the ages 45 and 64 in the United States with a correlation coefficient (R) of -0.346 and weighted average of $106,319, a difference of 29.4%.
Householder Income Ages 45 - 64 years Correlation Summary
| Measurement | Yuman | Immigrants from Poland |
| Minimum | $30,086 | $74,827 |
| Maximum | $147,152 | $151,262 |
| Range | $117,066 | $76,436 |
| Mean | $70,628 | $104,596 |
| Median | $70,888 | $104,115 |
| Interquartile 25% (IQ1) | $44,573 | $82,959 |
| Interquartile 75% (IQ3) | $88,954 | $116,688 |
| Interquartile Range (IQR) | $44,381 | $33,729 |
| Standard Deviation (Sample) | $30,431 | $20,034 |
| Standard Deviation (Population) | $29,465 | $19,708 |
Similar Demographics by Householder Income Ages 45 - 64 years
Demographics Similar to Yuman by Householder Income Ages 45 - 64 years
In terms of householder income ages 45 - 64 years, the demographic groups most similar to Yuman are Apache ($82,184, a difference of 0.050%), Chickasaw ($82,193, a difference of 0.070%), Choctaw ($82,287, a difference of 0.18%), Colville ($82,474, a difference of 0.41%), and Immigrants from Caribbean ($82,513, a difference of 0.46%).
| Demographics | Rating | Rank | Householder Income Ages 45 - 64 years |
| Immigrants | Honduras | 0.0 /100 | #314 | Tragic $82,697 |
| Paiute | 0.0 /100 | #315 | Tragic $82,629 |
| Immigrants | Caribbean | 0.0 /100 | #316 | Tragic $82,513 |
| Colville | 0.0 /100 | #317 | Tragic $82,474 |
| Choctaw | 0.0 /100 | #318 | Tragic $82,287 |
| Chickasaw | 0.0 /100 | #319 | Tragic $82,193 |
| Apache | 0.0 /100 | #320 | Tragic $82,184 |
| Yuman | 0.0 /100 | #321 | Tragic $82,139 |
| Sioux | 0.0 /100 | #322 | Tragic $81,750 |
| Bahamians | 0.0 /100 | #323 | Tragic $81,369 |
| Yup'ik | 0.0 /100 | #324 | Tragic $81,000 |
| Immigrants | Cuba | 0.0 /100 | #325 | Tragic $80,662 |
| Dominicans | 0.0 /100 | #326 | Tragic $80,623 |
| Seminole | 0.0 /100 | #327 | Tragic $80,077 |
| Natives/Alaskans | 0.0 /100 | #328 | Tragic $79,816 |
Demographics Similar to Immigrants from Poland by Householder Income Ages 45 - 64 years
In terms of householder income ages 45 - 64 years, the demographic groups most similar to Immigrants from Poland are Immigrants from Kuwait ($106,285, a difference of 0.030%), European ($106,367, a difference of 0.050%), British ($106,264, a difference of 0.050%), Swedish ($106,377, a difference of 0.060%), and Albanian ($106,243, a difference of 0.070%).
| Demographics | Rating | Rank | Householder Income Ages 45 - 64 years |
| Immigrants | Fiji | 96.5 /100 | #107 | Exceptional $106,952 |
| Zimbabweans | 96.3 /100 | #108 | Exceptional $106,849 |
| Chileans | 95.9 /100 | #109 | Exceptional $106,611 |
| Immigrants | Brazil | 95.6 /100 | #110 | Exceptional $106,470 |
| Immigrants | Vietnam | 95.5 /100 | #111 | Exceptional $106,417 |
| Swedes | 95.4 /100 | #112 | Exceptional $106,377 |
| Europeans | 95.4 /100 | #113 | Exceptional $106,367 |
| Immigrants | Poland | 95.3 /100 | #114 | Exceptional $106,319 |
| Immigrants | Kuwait | 95.2 /100 | #115 | Exceptional $106,285 |
| British | 95.2 /100 | #116 | Exceptional $106,264 |
| Albanians | 95.1 /100 | #117 | Exceptional $106,243 |
| Immigrants | Western Asia | 95.0 /100 | #118 | Exceptional $106,217 |
| Immigrants | Jordan | 94.9 /100 | #119 | Exceptional $106,164 |
| Immigrants | South Eastern Asia | 94.8 /100 | #120 | Exceptional $106,109 |
| Poles | 94.4 /100 | #121 | Exceptional $105,952 |