Immigrants from Western Africa vs Malaysian Householder Income Ages 45 - 64 years
COMPARE
Immigrants from Western Africa
Malaysian
Householder Income Ages 45 - 64 years
Householder Income Ages 45 - 64 years Comparison
Immigrants from Western Africa
Malaysians
$92,384
HOUSEHOLDER INCOME AGES 45 - 64 YEARS
1.8/ 100
METRIC RATING
236th/ 347
METRIC RANK
$94,517
HOUSEHOLDER INCOME AGES 45 - 64 YEARS
5.2/ 100
METRIC RATING
222nd/ 347
METRIC RANK
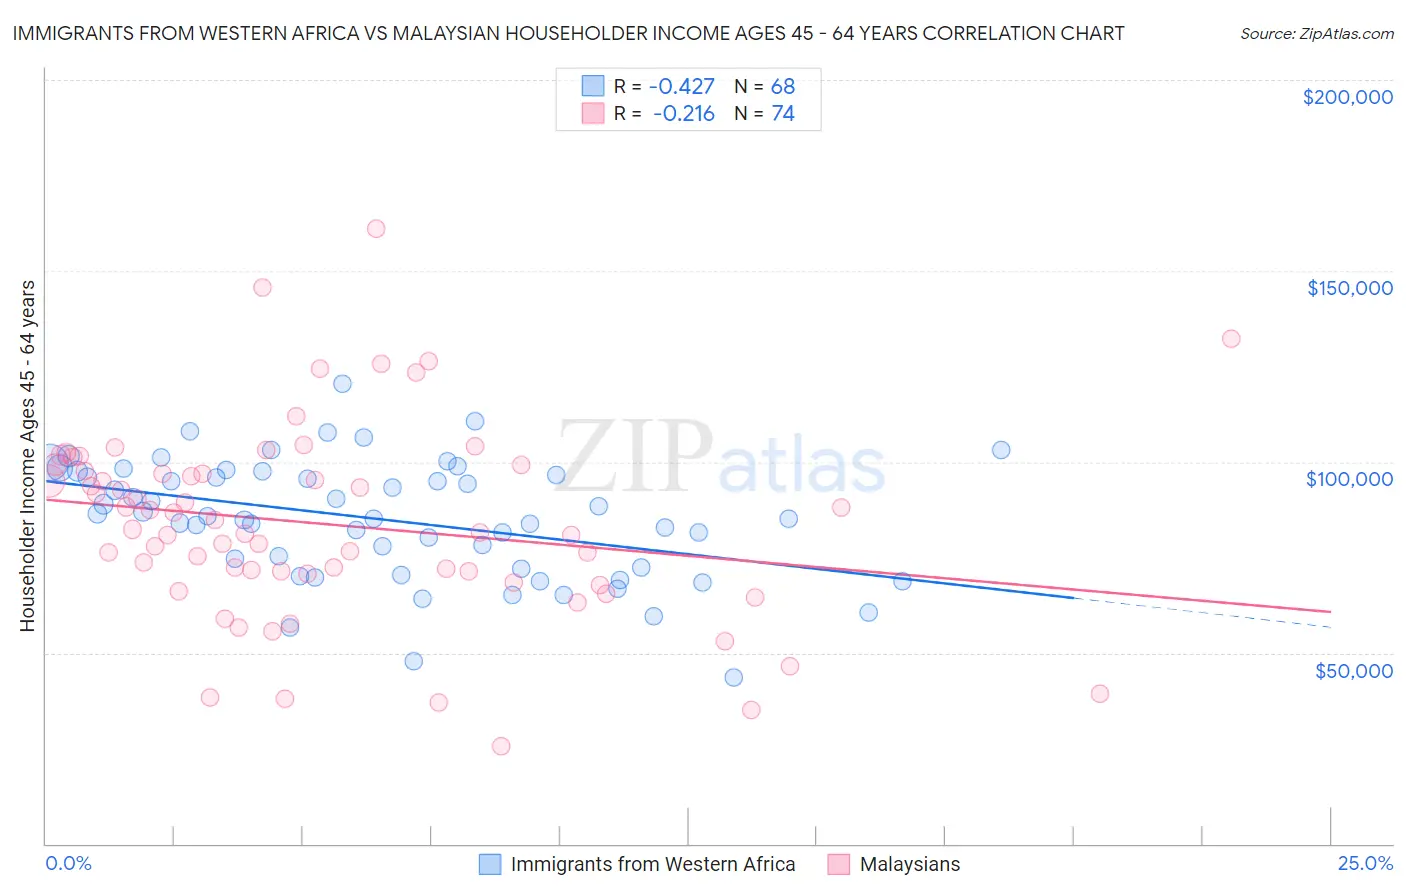
Immigrants from Western Africa vs Malaysian Householder Income Ages 45 - 64 years Correlation Chart
The statistical analysis conducted on geographies consisting of 357,146,562 people shows a moderate negative correlation between the proportion of Immigrants from Western Africa and household income with householder between the ages 45 and 64 in the United States with a correlation coefficient (R) of -0.427 and weighted average of $92,384. Similarly, the statistical analysis conducted on geographies consisting of 225,853,925 people shows a weak negative correlation between the proportion of Malaysians and household income with householder between the ages 45 and 64 in the United States with a correlation coefficient (R) of -0.216 and weighted average of $94,517, a difference of 2.3%.
Householder Income Ages 45 - 64 years Correlation Summary
| Measurement | Immigrants from Western Africa | Malaysian |
| Minimum | $43,559 | $25,536 |
| Maximum | $120,552 | $161,017 |
| Range | $76,993 | $135,481 |
| Mean | $84,916 | $83,626 |
| Median | $85,582 | $81,950 |
| Interquartile 25% (IQ1) | $72,214 | $70,625 |
| Interquartile 75% (IQ3) | $97,099 | $97,581 |
| Interquartile Range (IQR) | $24,885 | $26,956 |
| Standard Deviation (Sample) | $15,570 | $25,472 |
| Standard Deviation (Population) | $15,455 | $25,299 |
Demographics Similar to Immigrants from Western Africa and Malaysians by Householder Income Ages 45 - 64 years
In terms of householder income ages 45 - 64 years, the demographic groups most similar to Immigrants from Western Africa are Nicaraguan ($92,554, a difference of 0.18%), Immigrants from Bangladesh ($92,208, a difference of 0.19%), Pennsylvania German ($91,956, a difference of 0.46%), Immigrants from El Salvador ($93,176, a difference of 0.86%), and Immigrants from Ecuador ($91,462, a difference of 1.0%). Similarly, the demographic groups most similar to Malaysians are Nonimmigrants ($94,448, a difference of 0.070%), Immigrants from Bosnia and Herzegovina ($94,288, a difference of 0.24%), Immigrants from Nigeria ($94,804, a difference of 0.30%), Salvadoran ($94,842, a difference of 0.34%), and Bermudan ($94,197, a difference of 0.34%).
| Demographics | Rating | Rank | Householder Income Ages 45 - 64 years |
| Immigrants | Armenia | 6.1 /100 | #219 | Tragic $94,863 |
| Salvadorans | 6.0 /100 | #220 | Tragic $94,842 |
| Immigrants | Nigeria | 5.9 /100 | #221 | Tragic $94,804 |
| Malaysians | 5.2 /100 | #222 | Tragic $94,517 |
| Immigrants | Nonimmigrants | 5.0 /100 | #223 | Tragic $94,448 |
| Immigrants | Bosnia and Herzegovina | 4.6 /100 | #224 | Tragic $94,288 |
| Bermudans | 4.4 /100 | #225 | Tragic $94,197 |
| Immigrants | Azores | 4.3 /100 | #226 | Tragic $94,138 |
| Alaska Natives | 4.0 /100 | #227 | Tragic $93,991 |
| Immigrants | Panama | 3.7 /100 | #228 | Tragic $93,815 |
| Vietnamese | 3.6 /100 | #229 | Tragic $93,788 |
| Immigrants | Sudan | 3.6 /100 | #230 | Tragic $93,781 |
| Ecuadorians | 3.6 /100 | #231 | Tragic $93,739 |
| Sudanese | 3.5 /100 | #232 | Tragic $93,718 |
| Nepalese | 3.0 /100 | #233 | Tragic $93,355 |
| Immigrants | El Salvador | 2.7 /100 | #234 | Tragic $93,176 |
| Nicaraguans | 2.0 /100 | #235 | Tragic $92,554 |
| Immigrants | Western Africa | 1.8 /100 | #236 | Tragic $92,384 |
| Immigrants | Bangladesh | 1.7 /100 | #237 | Tragic $92,208 |
| Pennsylvania Germans | 1.5 /100 | #238 | Tragic $91,956 |
| Immigrants | Ecuador | 1.2 /100 | #239 | Tragic $91,462 |