Yuman vs Immigrants from Romania 11th Grade
COMPARE
Yuman
Immigrants from Romania
11th Grade
11th Grade Comparison
Yuman
Immigrants from Romania
89.7%
11TH GRADE
0.0/ 100
METRIC RATING
304th/ 347
METRIC RANK
93.5%
11TH GRADE
98.7/ 100
METRIC RATING
101st/ 347
METRIC RANK
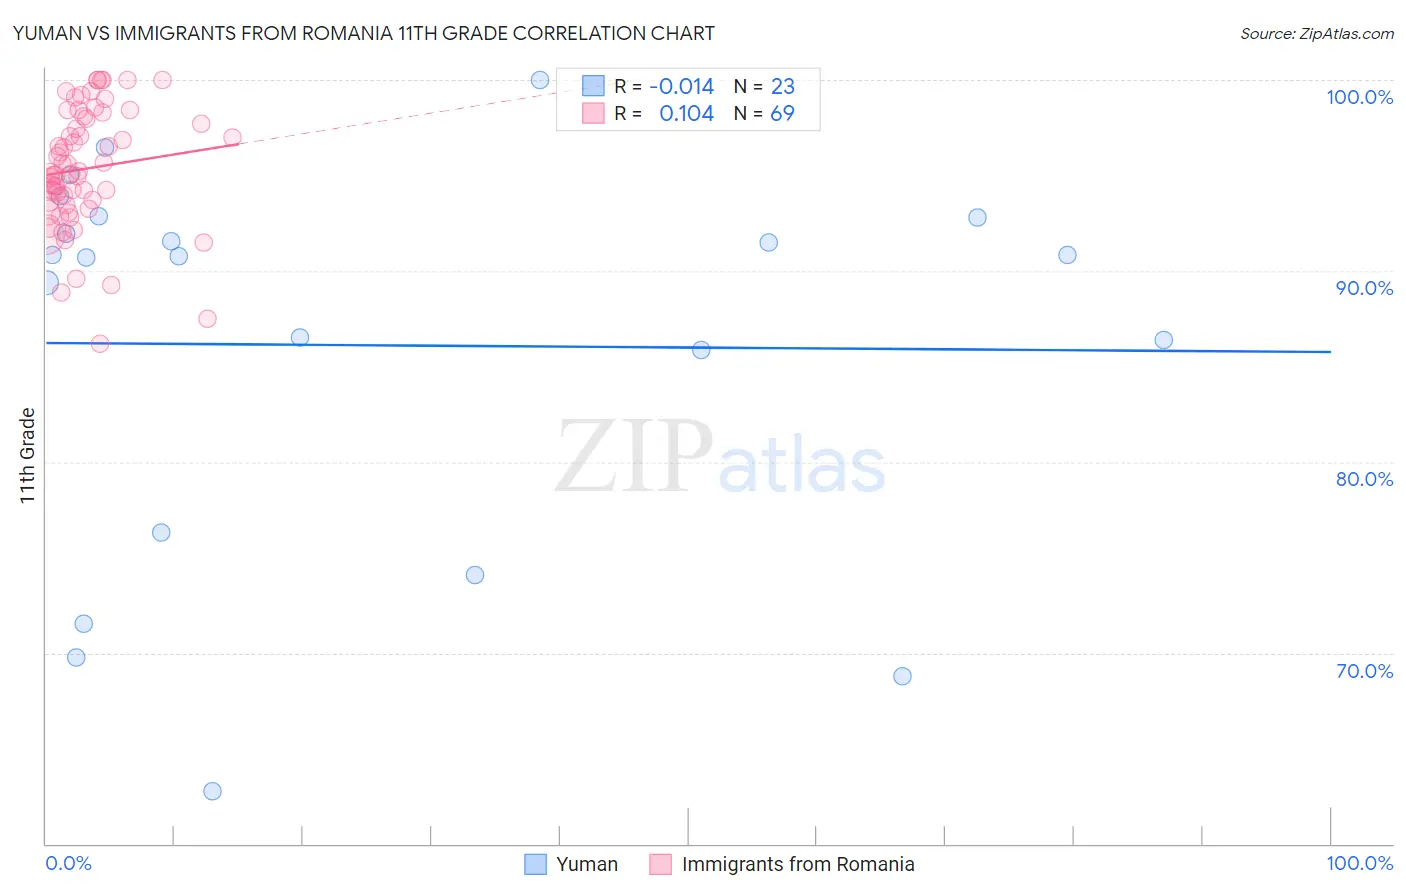
Yuman vs Immigrants from Romania 11th Grade Correlation Chart
The statistical analysis conducted on geographies consisting of 40,696,349 people shows no correlation between the proportion of Yuman and percentage of population with at least 11th grade education in the United States with a correlation coefficient (R) of -0.014 and weighted average of 89.7%. Similarly, the statistical analysis conducted on geographies consisting of 257,013,351 people shows a poor positive correlation between the proportion of Immigrants from Romania and percentage of population with at least 11th grade education in the United States with a correlation coefficient (R) of 0.104 and weighted average of 93.5%, a difference of 4.2%.
11th Grade Correlation Summary
| Measurement | Yuman | Immigrants from Romania |
| Minimum | 62.7% | 86.2% |
| Maximum | 100.0% | 100.0% |
| Range | 37.3% | 13.8% |
| Mean | 86.1% | 95.4% |
| Median | 90.8% | 95.2% |
| Interquartile 25% (IQ1) | 76.3% | 93.6% |
| Interquartile 75% (IQ3) | 92.8% | 98.1% |
| Interquartile Range (IQR) | 16.5% | 4.5% |
| Standard Deviation (Sample) | 10.2% | 3.1% |
| Standard Deviation (Population) | 10.0% | 3.1% |
Similar Demographics by 11th Grade
Demographics Similar to Yuman by 11th Grade
In terms of 11th grade, the demographic groups most similar to Yuman are Immigrants (89.7%, a difference of 0.0%), Immigrants from Guyana (89.7%, a difference of 0.010%), Immigrants from Cambodia (89.6%, a difference of 0.080%), Ecuadorian (89.6%, a difference of 0.13%), and Immigrants from Dominica (89.5%, a difference of 0.18%).
| Demographics | Rating | Rank | 11th Grade |
| Navajo | 0.0 /100 | #297 | Tragic 90.0% |
| Immigrants | Fiji | 0.0 /100 | #298 | Tragic 89.9% |
| Japanese | 0.0 /100 | #299 | Tragic 89.9% |
| Immigrants | Haiti | 0.0 /100 | #300 | Tragic 89.9% |
| Guyanese | 0.0 /100 | #301 | Tragic 89.9% |
| Immigrants | Guyana | 0.0 /100 | #302 | Tragic 89.7% |
| Immigrants | Immigrants | 0.0 /100 | #303 | Tragic 89.7% |
| Yuman | 0.0 /100 | #304 | Tragic 89.7% |
| Immigrants | Cambodia | 0.0 /100 | #305 | Tragic 89.6% |
| Ecuadorians | 0.0 /100 | #306 | Tragic 89.6% |
| Immigrants | Dominica | 0.0 /100 | #307 | Tragic 89.5% |
| Nepalese | 0.0 /100 | #308 | Tragic 89.5% |
| Immigrants | Bangladesh | 0.0 /100 | #309 | Tragic 89.5% |
| Yaqui | 0.0 /100 | #310 | Tragic 89.5% |
| Vietnamese | 0.0 /100 | #311 | Tragic 89.4% |
Demographics Similar to Immigrants from Romania by 11th Grade
In terms of 11th grade, the demographic groups most similar to Immigrants from Romania are Immigrants from North Macedonia (93.5%, a difference of 0.010%), Chippewa (93.5%, a difference of 0.010%), Lebanese (93.5%, a difference of 0.010%), Immigrants from Europe (93.5%, a difference of 0.010%), and Immigrants from Serbia (93.5%, a difference of 0.010%).
| Demographics | Rating | Rank | 11th Grade |
| Swiss | 99.0 /100 | #94 | Exceptional 93.6% |
| Immigrants | France | 99.0 /100 | #95 | Exceptional 93.6% |
| Immigrants | Turkey | 98.9 /100 | #96 | Exceptional 93.5% |
| Immigrants | Iran | 98.9 /100 | #97 | Exceptional 93.5% |
| Immigrants | Israel | 98.8 /100 | #98 | Exceptional 93.5% |
| Menominee | 98.7 /100 | #99 | Exceptional 93.5% |
| Immigrants | North Macedonia | 98.7 /100 | #100 | Exceptional 93.5% |
| Immigrants | Romania | 98.7 /100 | #101 | Exceptional 93.5% |
| Chippewa | 98.6 /100 | #102 | Exceptional 93.5% |
| Lebanese | 98.6 /100 | #103 | Exceptional 93.5% |
| Immigrants | Europe | 98.6 /100 | #104 | Exceptional 93.5% |
| Immigrants | Serbia | 98.6 /100 | #105 | Exceptional 93.5% |
| Immigrants | Croatia | 98.6 /100 | #106 | Exceptional 93.5% |
| Immigrants | Norway | 98.4 /100 | #107 | Exceptional 93.5% |
| Alaska Natives | 98.4 /100 | #108 | Exceptional 93.5% |